Israeli vs Honduran Cognitive Disability
COMPARE
Israeli
Honduran
Cognitive Disability
Cognitive Disability Comparison
Israelis
Hondurans
17.0%
COGNITIVE DISABILITY
91.0/ 100
METRIC RATING
136th/ 347
METRIC RANK
18.0%
COGNITIVE DISABILITY
0.3/ 100
METRIC RATING
269th/ 347
METRIC RANK
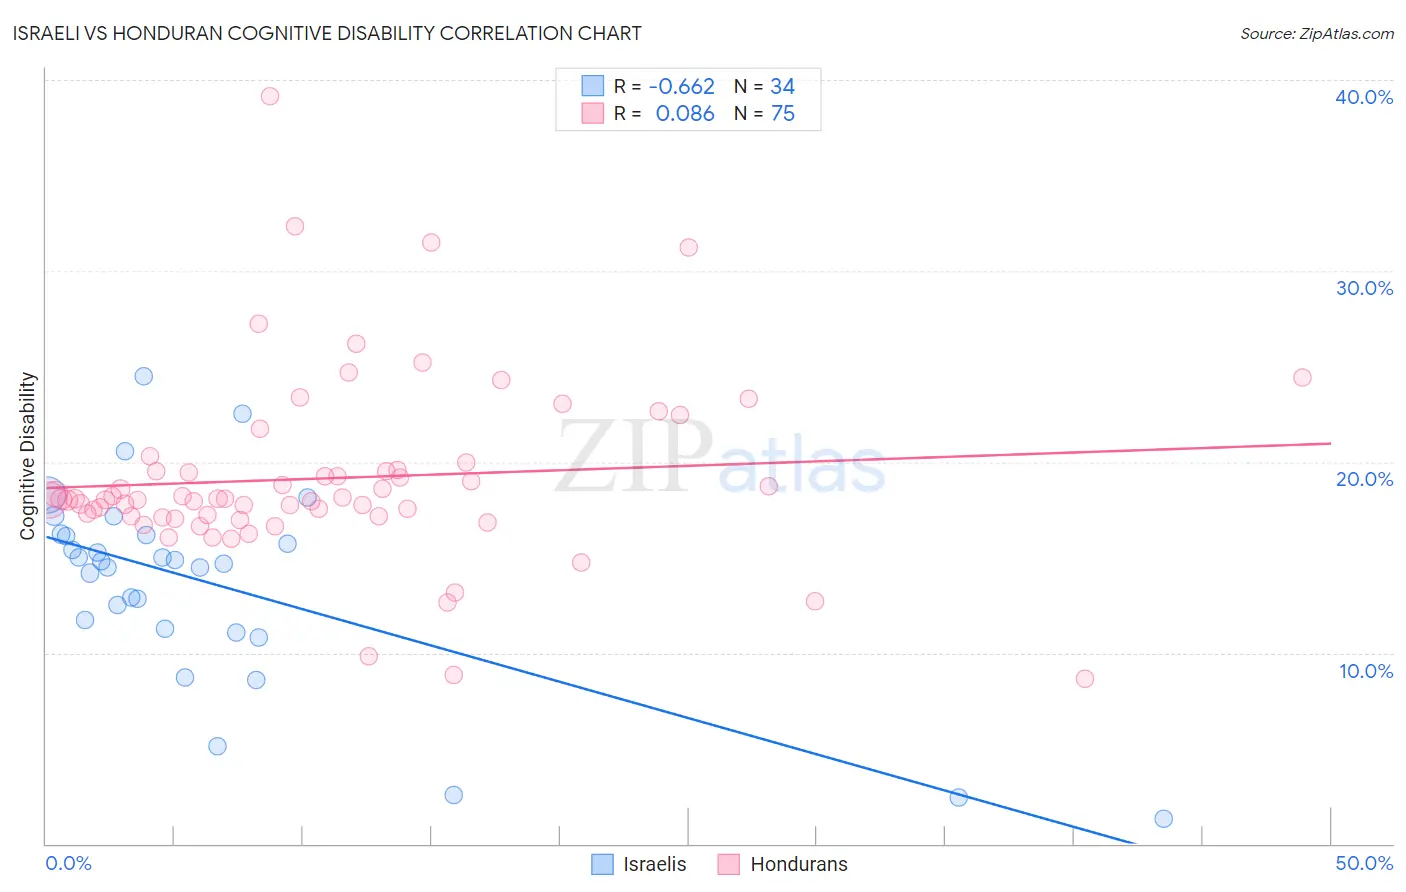
Israeli vs Honduran Cognitive Disability Correlation Chart
The statistical analysis conducted on geographies consisting of 211,174,000 people shows a significant negative correlation between the proportion of Israelis and percentage of population with cognitive disability in the United States with a correlation coefficient (R) of -0.662 and weighted average of 17.0%. Similarly, the statistical analysis conducted on geographies consisting of 357,766,918 people shows a slight positive correlation between the proportion of Hondurans and percentage of population with cognitive disability in the United States with a correlation coefficient (R) of 0.086 and weighted average of 18.0%, a difference of 5.9%.
Cognitive Disability Correlation Summary
| Measurement | Israeli | Honduran |
| Minimum | 1.3% | 8.7% |
| Maximum | 24.5% | 39.1% |
| Range | 23.1% | 30.5% |
| Mean | 13.6% | 19.1% |
| Median | 14.7% | 18.0% |
| Interquartile 25% (IQ1) | 11.3% | 17.1% |
| Interquartile 75% (IQ3) | 16.2% | 19.6% |
| Interquartile Range (IQR) | 4.9% | 2.5% |
| Standard Deviation (Sample) | 5.2% | 4.9% |
| Standard Deviation (Population) | 5.1% | 4.8% |
Similar Demographics by Cognitive Disability
Demographics Similar to Israelis by Cognitive Disability
In terms of cognitive disability, the demographic groups most similar to Israelis are Immigrants from Norway (17.0%, a difference of 0.0%), Welsh (17.0%, a difference of 0.020%), Lebanese (17.0%, a difference of 0.030%), Immigrants from Chile (17.0%, a difference of 0.060%), and Immigrants from Jordan (17.0%, a difference of 0.080%).
| Demographics | Rating | Rank | Cognitive Disability |
| Immigrants | Uruguay | 92.9 /100 | #129 | Exceptional 17.0% |
| Immigrants | Vietnam | 92.4 /100 | #130 | Exceptional 17.0% |
| Immigrants | Germany | 92.1 /100 | #131 | Exceptional 17.0% |
| Whites/Caucasians | 92.1 /100 | #132 | Exceptional 17.0% |
| Immigrants | Jordan | 91.9 /100 | #133 | Exceptional 17.0% |
| Immigrants | Chile | 91.7 /100 | #134 | Exceptional 17.0% |
| Lebanese | 91.3 /100 | #135 | Exceptional 17.0% |
| Israelis | 91.0 /100 | #136 | Exceptional 17.0% |
| Immigrants | Norway | 90.9 /100 | #137 | Exceptional 17.0% |
| Welsh | 90.8 /100 | #138 | Exceptional 17.0% |
| French | 90.0 /100 | #139 | Excellent 17.0% |
| Chileans | 89.9 /100 | #140 | Excellent 17.0% |
| Aleuts | 89.9 /100 | #141 | Excellent 17.0% |
| Carpatho Rusyns | 89.6 /100 | #142 | Excellent 17.0% |
| British | 89.3 /100 | #143 | Excellent 17.0% |
Demographics Similar to Hondurans by Cognitive Disability
In terms of cognitive disability, the demographic groups most similar to Hondurans are Immigrants from Bahamas (18.0%, a difference of 0.010%), Potawatomi (18.0%, a difference of 0.080%), Immigrants from Honduras (18.0%, a difference of 0.10%), Cherokee (18.0%, a difference of 0.14%), and Nepalese (18.0%, a difference of 0.15%).
| Demographics | Rating | Rank | Cognitive Disability |
| Sierra Leoneans | 0.4 /100 | #262 | Tragic 17.9% |
| Immigrants | Barbados | 0.4 /100 | #263 | Tragic 17.9% |
| Menominee | 0.4 /100 | #264 | Tragic 18.0% |
| Spanish Americans | 0.4 /100 | #265 | Tragic 18.0% |
| Belizeans | 0.4 /100 | #266 | Tragic 18.0% |
| Nepalese | 0.3 /100 | #267 | Tragic 18.0% |
| Cherokee | 0.3 /100 | #268 | Tragic 18.0% |
| Hondurans | 0.3 /100 | #269 | Tragic 18.0% |
| Immigrants | Bahamas | 0.3 /100 | #270 | Tragic 18.0% |
| Potawatomi | 0.2 /100 | #271 | Tragic 18.0% |
| Immigrants | Honduras | 0.2 /100 | #272 | Tragic 18.0% |
| Immigrants | Nepal | 0.2 /100 | #273 | Tragic 18.0% |
| Immigrants | Nigeria | 0.2 /100 | #274 | Tragic 18.0% |
| Immigrants | Laos | 0.2 /100 | #275 | Tragic 18.1% |
| Yuman | 0.2 /100 | #276 | Tragic 18.1% |