Central American Indian vs Latvian Ambulatory Disability
COMPARE
Central American Indian
Latvian
Ambulatory Disability
Ambulatory Disability Comparison
Central American Indians
Latvians
7.2%
AMBULATORY DISABILITY
0.0/ 100
METRIC RATING
317th/ 347
METRIC RANK
5.7%
AMBULATORY DISABILITY
99.0/ 100
METRIC RATING
86th/ 347
METRIC RANK
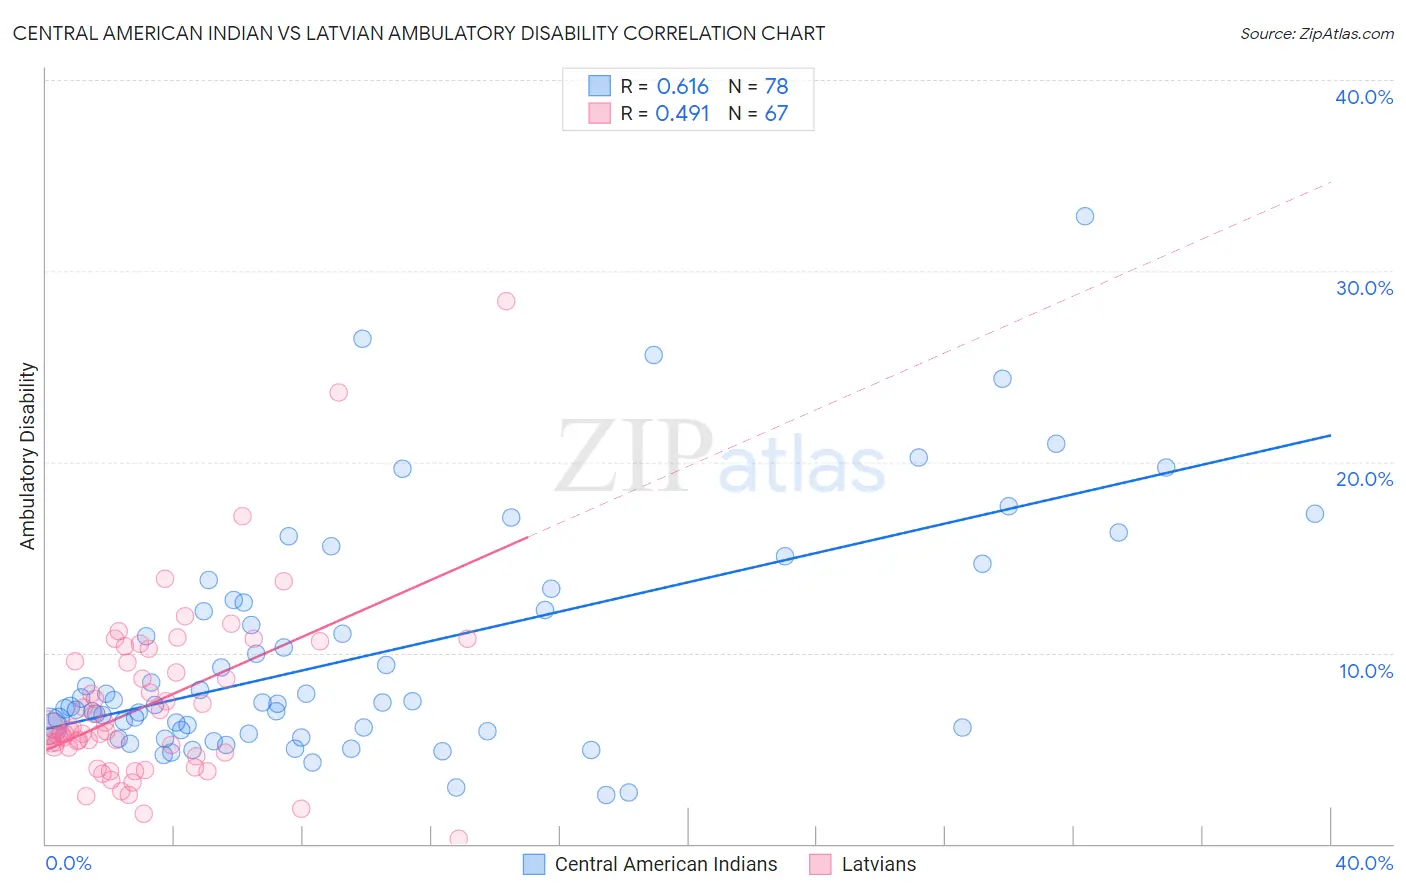
Central American Indian vs Latvian Ambulatory Disability Correlation Chart
The statistical analysis conducted on geographies consisting of 326,071,152 people shows a significant positive correlation between the proportion of Central American Indians and percentage of population with ambulatory disability in the United States with a correlation coefficient (R) of 0.616 and weighted average of 7.2%. Similarly, the statistical analysis conducted on geographies consisting of 220,706,558 people shows a moderate positive correlation between the proportion of Latvians and percentage of population with ambulatory disability in the United States with a correlation coefficient (R) of 0.491 and weighted average of 5.7%, a difference of 24.5%.
Ambulatory Disability Correlation Summary
| Measurement | Central American Indian | Latvian |
| Minimum | 2.6% | 0.23% |
| Maximum | 32.9% | 28.4% |
| Range | 30.3% | 28.1% |
| Mean | 9.9% | 7.3% |
| Median | 7.4% | 5.9% |
| Interquartile 25% (IQ1) | 6.0% | 4.8% |
| Interquartile 75% (IQ3) | 12.6% | 9.6% |
| Interquartile Range (IQR) | 6.7% | 4.8% |
| Standard Deviation (Sample) | 6.1% | 4.6% |
| Standard Deviation (Population) | 6.0% | 4.6% |
Similar Demographics by Ambulatory Disability
Demographics Similar to Central American Indians by Ambulatory Disability
In terms of ambulatory disability, the demographic groups most similar to Central American Indians are Immigrants from Dominican Republic (7.1%, a difference of 0.080%), Ottawa (7.2%, a difference of 0.090%), Shoshone (7.1%, a difference of 0.32%), Blackfeet (7.1%, a difference of 0.34%), and Immigrants from Yemen (7.1%, a difference of 0.36%).
| Demographics | Rating | Rank | Ambulatory Disability |
| Arapaho | 0.0 /100 | #310 | Tragic 7.1% |
| Cree | 0.0 /100 | #311 | Tragic 7.1% |
| Delaware | 0.0 /100 | #312 | Tragic 7.1% |
| Immigrants | Yemen | 0.0 /100 | #313 | Tragic 7.1% |
| Blackfeet | 0.0 /100 | #314 | Tragic 7.1% |
| Shoshone | 0.0 /100 | #315 | Tragic 7.1% |
| Immigrants | Dominican Republic | 0.0 /100 | #316 | Tragic 7.1% |
| Central American Indians | 0.0 /100 | #317 | Tragic 7.2% |
| Ottawa | 0.0 /100 | #318 | Tragic 7.2% |
| Dominicans | 0.0 /100 | #319 | Tragic 7.2% |
| Potawatomi | 0.0 /100 | #320 | Tragic 7.3% |
| Apache | 0.0 /100 | #321 | Tragic 7.4% |
| Osage | 0.0 /100 | #322 | Tragic 7.4% |
| Americans | 0.0 /100 | #323 | Tragic 7.4% |
| Navajo | 0.0 /100 | #324 | Tragic 7.5% |
Demographics Similar to Latvians by Ambulatory Disability
In terms of ambulatory disability, the demographic groups most similar to Latvians are South American (5.7%, a difference of 0.030%), Immigrants from Chile (5.8%, a difference of 0.060%), Soviet Union (5.8%, a difference of 0.11%), Bhutanese (5.8%, a difference of 0.23%), and Australian (5.8%, a difference of 0.23%).
| Demographics | Rating | Rank | Ambulatory Disability |
| Chileans | 99.2 /100 | #79 | Exceptional 5.7% |
| Immigrants | Ireland | 99.2 /100 | #80 | Exceptional 5.7% |
| Immigrants | Jordan | 99.2 /100 | #81 | Exceptional 5.7% |
| Palestinians | 99.2 /100 | #82 | Exceptional 5.7% |
| Eastern Europeans | 99.2 /100 | #83 | Exceptional 5.7% |
| Ugandans | 99.2 /100 | #84 | Exceptional 5.7% |
| South Americans | 99.0 /100 | #85 | Exceptional 5.7% |
| Latvians | 99.0 /100 | #86 | Exceptional 5.7% |
| Immigrants | Chile | 98.9 /100 | #87 | Exceptional 5.8% |
| Soviet Union | 98.9 /100 | #88 | Exceptional 5.8% |
| Bhutanese | 98.8 /100 | #89 | Exceptional 5.8% |
| Australians | 98.8 /100 | #90 | Exceptional 5.8% |
| Immigrants | Sudan | 98.8 /100 | #91 | Exceptional 5.8% |
| Immigrants | Sierra Leone | 98.6 /100 | #92 | Exceptional 5.8% |
| Immigrants | Denmark | 98.6 /100 | #93 | Exceptional 5.8% |