Portuguese vs Latvian Ambulatory Disability
COMPARE
Portuguese
Latvian
Ambulatory Disability
Ambulatory Disability Comparison
Portuguese
Latvians
6.4%
AMBULATORY DISABILITY
4.0/ 100
METRIC RATING
228th/ 347
METRIC RANK
5.7%
AMBULATORY DISABILITY
99.0/ 100
METRIC RATING
86th/ 347
METRIC RANK
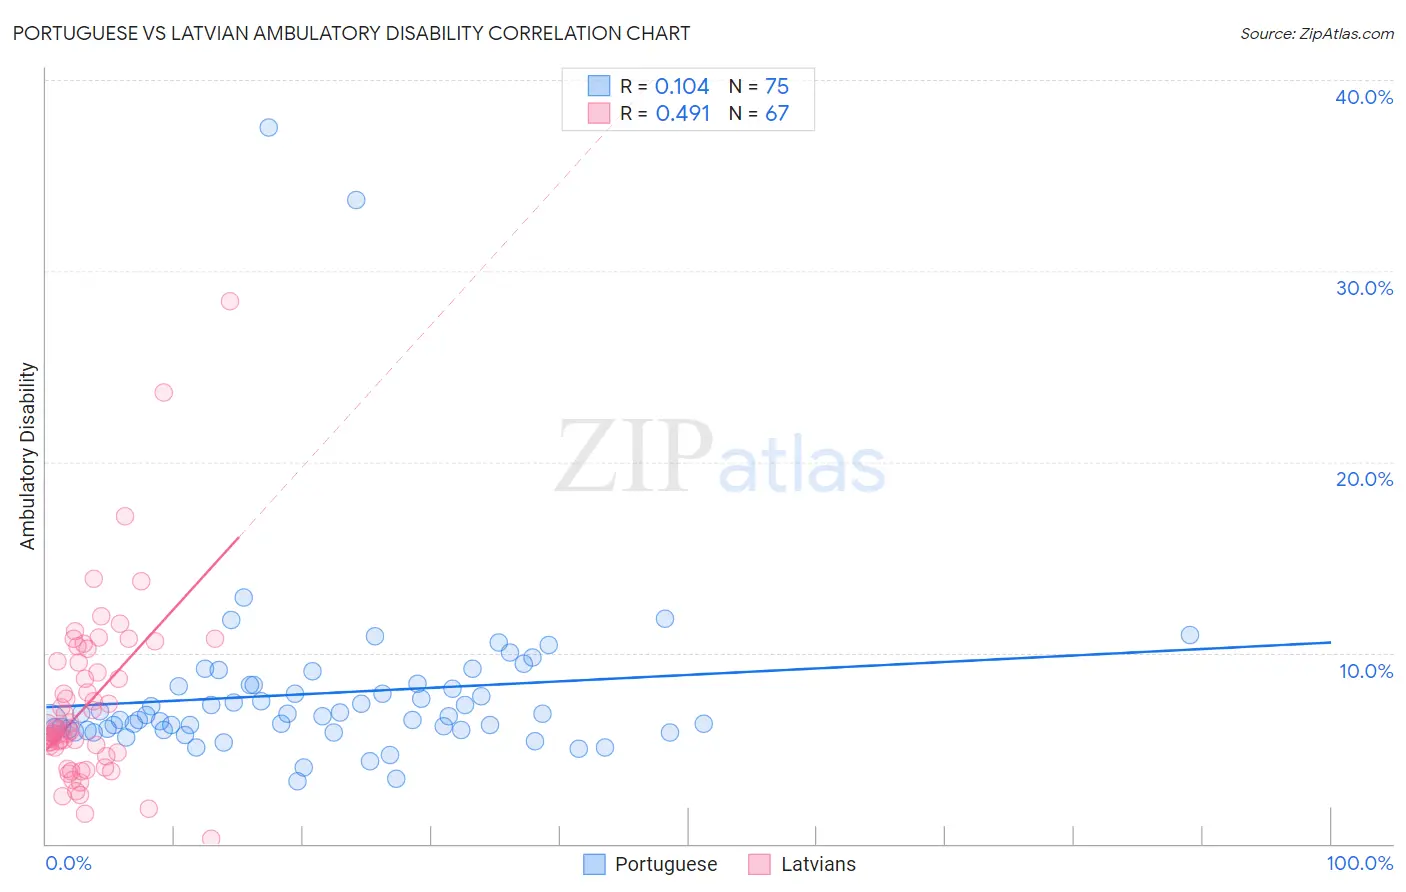
Portuguese vs Latvian Ambulatory Disability Correlation Chart
The statistical analysis conducted on geographies consisting of 450,087,424 people shows a poor positive correlation between the proportion of Portuguese and percentage of population with ambulatory disability in the United States with a correlation coefficient (R) of 0.104 and weighted average of 6.4%. Similarly, the statistical analysis conducted on geographies consisting of 220,706,558 people shows a moderate positive correlation between the proportion of Latvians and percentage of population with ambulatory disability in the United States with a correlation coefficient (R) of 0.491 and weighted average of 5.7%, a difference of 10.9%.
Ambulatory Disability Correlation Summary
| Measurement | Portuguese | Latvian |
| Minimum | 3.3% | 0.23% |
| Maximum | 37.5% | 28.4% |
| Range | 34.2% | 28.1% |
| Mean | 7.9% | 7.3% |
| Median | 6.7% | 5.9% |
| Interquartile 25% (IQ1) | 6.0% | 4.8% |
| Interquartile 75% (IQ3) | 8.3% | 9.6% |
| Interquartile Range (IQR) | 2.3% | 4.8% |
| Standard Deviation (Sample) | 5.0% | 4.6% |
| Standard Deviation (Population) | 5.0% | 4.6% |
Similar Demographics by Ambulatory Disability
Demographics Similar to Portuguese by Ambulatory Disability
In terms of ambulatory disability, the demographic groups most similar to Portuguese are Cuban (6.4%, a difference of 0.010%), Czechoslovakian (6.4%, a difference of 0.050%), Mexican (6.4%, a difference of 0.15%), Panamanian (6.4%, a difference of 0.31%), and Slavic (6.4%, a difference of 0.34%).
| Demographics | Rating | Rank | Ambulatory Disability |
| Hungarians | 9.6 /100 | #221 | Tragic 6.3% |
| German Russians | 9.4 /100 | #222 | Tragic 6.3% |
| Immigrants | Honduras | 7.6 /100 | #223 | Tragic 6.3% |
| Liberians | 7.1 /100 | #224 | Tragic 6.3% |
| Hondurans | 6.3 /100 | #225 | Tragic 6.3% |
| Slavs | 5.1 /100 | #226 | Tragic 6.4% |
| Cubans | 4.0 /100 | #227 | Tragic 6.4% |
| Portuguese | 4.0 /100 | #228 | Tragic 6.4% |
| Czechoslovakians | 3.8 /100 | #229 | Tragic 6.4% |
| Mexicans | 3.5 /100 | #230 | Tragic 6.4% |
| Panamanians | 3.1 /100 | #231 | Tragic 6.4% |
| Assyrians/Chaldeans/Syriacs | 2.4 /100 | #232 | Tragic 6.4% |
| Sub-Saharan Africans | 2.3 /100 | #233 | Tragic 6.4% |
| Immigrants | Liberia | 2.3 /100 | #234 | Tragic 6.4% |
| Hispanics or Latinos | 2.2 /100 | #235 | Tragic 6.4% |
Demographics Similar to Latvians by Ambulatory Disability
In terms of ambulatory disability, the demographic groups most similar to Latvians are South American (5.7%, a difference of 0.030%), Immigrants from Chile (5.8%, a difference of 0.060%), Soviet Union (5.8%, a difference of 0.11%), Bhutanese (5.8%, a difference of 0.23%), and Australian (5.8%, a difference of 0.23%).
| Demographics | Rating | Rank | Ambulatory Disability |
| Chileans | 99.2 /100 | #79 | Exceptional 5.7% |
| Immigrants | Ireland | 99.2 /100 | #80 | Exceptional 5.7% |
| Immigrants | Jordan | 99.2 /100 | #81 | Exceptional 5.7% |
| Palestinians | 99.2 /100 | #82 | Exceptional 5.7% |
| Eastern Europeans | 99.2 /100 | #83 | Exceptional 5.7% |
| Ugandans | 99.2 /100 | #84 | Exceptional 5.7% |
| South Americans | 99.0 /100 | #85 | Exceptional 5.7% |
| Latvians | 99.0 /100 | #86 | Exceptional 5.7% |
| Immigrants | Chile | 98.9 /100 | #87 | Exceptional 5.8% |
| Soviet Union | 98.9 /100 | #88 | Exceptional 5.8% |
| Bhutanese | 98.8 /100 | #89 | Exceptional 5.8% |
| Australians | 98.8 /100 | #90 | Exceptional 5.8% |
| Immigrants | Sudan | 98.8 /100 | #91 | Exceptional 5.8% |
| Immigrants | Sierra Leone | 98.6 /100 | #92 | Exceptional 5.8% |
| Immigrants | Denmark | 98.6 /100 | #93 | Exceptional 5.8% |