Israeli vs Immigrants from Iran Family Households
COMPARE
Israeli
Immigrants from Iran
Family Households
Family Households Comparison
Israelis
Immigrants from Iran
63.1%
FAMILY HOUSEHOLDS
0.4/ 100
METRIC RATING
267th/ 347
METRIC RANK
64.1%
FAMILY HOUSEHOLDS
30.4/ 100
METRIC RATING
185th/ 347
METRIC RANK
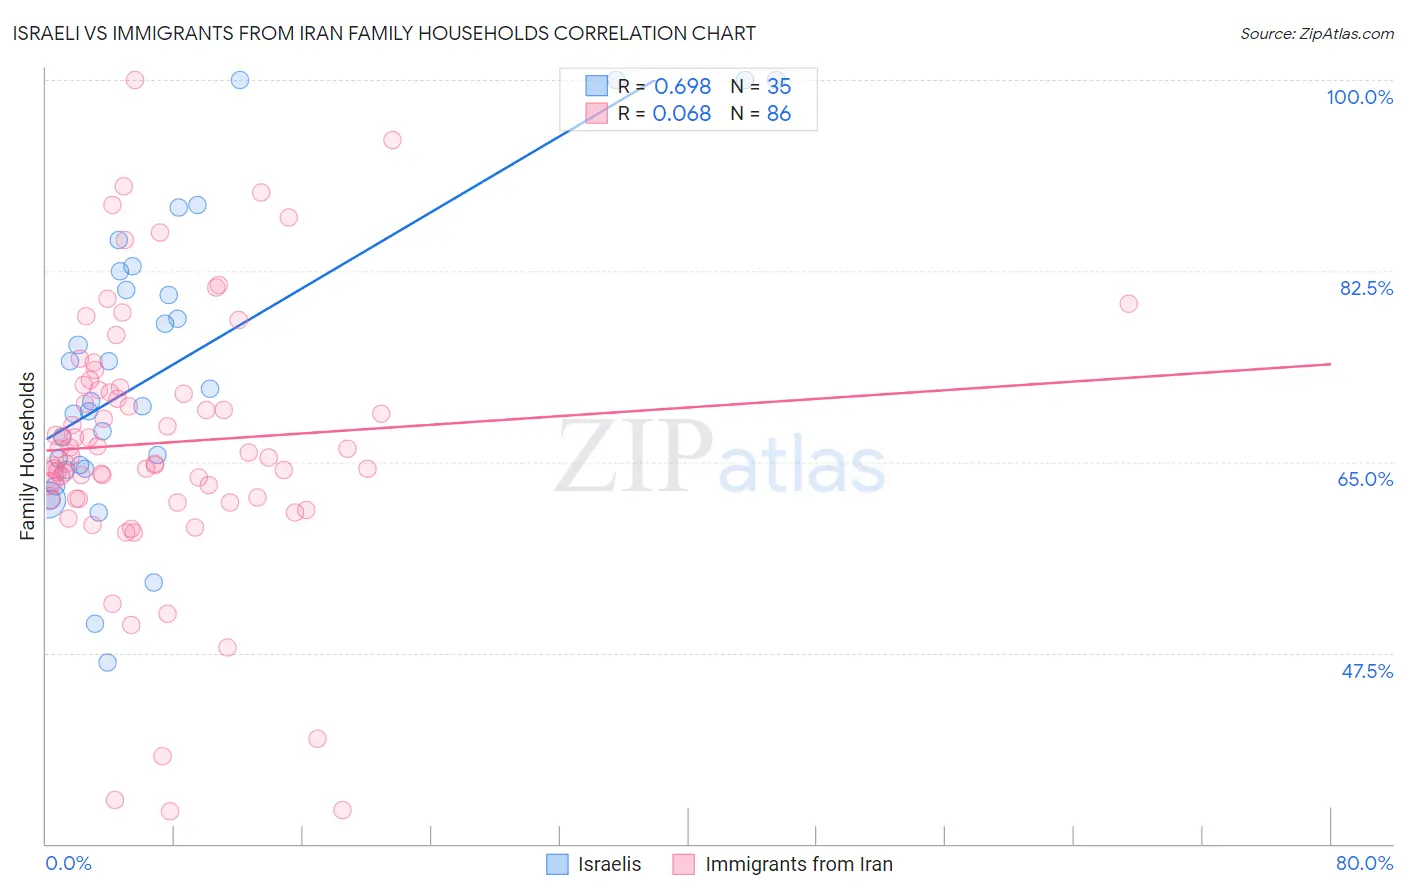
Israeli vs Immigrants from Iran Family Households Correlation Chart
The statistical analysis conducted on geographies consisting of 210,999,520 people shows a significant positive correlation between the proportion of Israelis and percentage of family households in the United States with a correlation coefficient (R) of 0.698 and weighted average of 63.1%. Similarly, the statistical analysis conducted on geographies consisting of 279,831,456 people shows a slight positive correlation between the proportion of Immigrants from Iran and percentage of family households in the United States with a correlation coefficient (R) of 0.068 and weighted average of 64.1%, a difference of 1.6%.
Family Households Correlation Summary
| Measurement | Israeli | Immigrants from Iran |
| Minimum | 46.6% | 33.0% |
| Maximum | 100.0% | 100.0% |
| Range | 53.4% | 67.0% |
| Mean | 73.6% | 66.7% |
| Median | 70.5% | 65.7% |
| Interquartile 25% (IQ1) | 64.4% | 61.7% |
| Interquartile 75% (IQ3) | 82.5% | 71.8% |
| Interquartile Range (IQR) | 18.1% | 10.2% |
| Standard Deviation (Sample) | 13.8% | 12.3% |
| Standard Deviation (Population) | 13.6% | 12.3% |
Similar Demographics by Family Households
Demographics Similar to Israelis by Family Households
In terms of family households, the demographic groups most similar to Israelis are Immigrants from Western Africa (63.1%, a difference of 0.040%), Colville (63.2%, a difference of 0.050%), Immigrants from Singapore (63.1%, a difference of 0.050%), Cheyenne (63.2%, a difference of 0.060%), and Kenyan (63.2%, a difference of 0.060%).
| Demographics | Rating | Rank | Family Households |
| Cypriots | 0.6 /100 | #260 | Tragic 63.2% |
| Immigrants | Russia | 0.6 /100 | #261 | Tragic 63.2% |
| Immigrants | Ireland | 0.6 /100 | #262 | Tragic 63.2% |
| Cheyenne | 0.5 /100 | #263 | Tragic 63.2% |
| Kenyans | 0.5 /100 | #264 | Tragic 63.2% |
| Colville | 0.5 /100 | #265 | Tragic 63.2% |
| Immigrants | Western Africa | 0.5 /100 | #266 | Tragic 63.1% |
| Israelis | 0.4 /100 | #267 | Tragic 63.1% |
| Immigrants | Singapore | 0.4 /100 | #268 | Tragic 63.1% |
| Yugoslavians | 0.4 /100 | #269 | Tragic 63.1% |
| Immigrants | Austria | 0.3 /100 | #270 | Tragic 63.1% |
| Immigrants | Croatia | 0.3 /100 | #271 | Tragic 63.1% |
| Immigrants | Turkey | 0.3 /100 | #272 | Tragic 63.1% |
| Immigrants | Kazakhstan | 0.3 /100 | #273 | Tragic 63.1% |
| Lumbee | 0.3 /100 | #274 | Tragic 63.1% |
Demographics Similar to Immigrants from Iran by Family Households
In terms of family households, the demographic groups most similar to Immigrants from Iran are Spanish American (64.1%, a difference of 0.010%), Northern European (64.1%, a difference of 0.040%), Puerto Rican (64.2%, a difference of 0.050%), Ukrainian (64.2%, a difference of 0.060%), and Creek (64.2%, a difference of 0.060%).
| Demographics | Rating | Rank | Family Households |
| Jamaicans | 40.6 /100 | #178 | Average 64.2% |
| Immigrants | Ukraine | 38.2 /100 | #179 | Fair 64.2% |
| Immigrants | Honduras | 35.0 /100 | #180 | Fair 64.2% |
| Immigrants | Trinidad and Tobago | 34.9 /100 | #181 | Fair 64.2% |
| Ukrainians | 34.6 /100 | #182 | Fair 64.2% |
| Creek | 34.1 /100 | #183 | Fair 64.2% |
| Puerto Ricans | 33.4 /100 | #184 | Fair 64.2% |
| Immigrants | Iran | 30.4 /100 | #185 | Fair 64.1% |
| Spanish Americans | 30.1 /100 | #186 | Fair 64.1% |
| Northern Europeans | 28.2 /100 | #187 | Fair 64.1% |
| Paraguayans | 26.7 /100 | #188 | Fair 64.1% |
| Immigrants | Western Asia | 25.3 /100 | #189 | Fair 64.1% |
| Zimbabweans | 24.7 /100 | #190 | Fair 64.1% |
| Arabs | 24.5 /100 | #191 | Fair 64.1% |
| Lithuanians | 23.8 /100 | #192 | Fair 64.0% |