Immigrants from Denmark vs Yugoslavian Cognitive Disability
COMPARE
Immigrants from Denmark
Yugoslavian
Cognitive Disability
Cognitive Disability Comparison
Immigrants from Denmark
Yugoslavians
16.9%
COGNITIVE DISABILITY
96.2/ 100
METRIC RATING
118th/ 347
METRIC RANK
17.2%
COGNITIVE DISABILITY
71.6/ 100
METRIC RATING
162nd/ 347
METRIC RANK
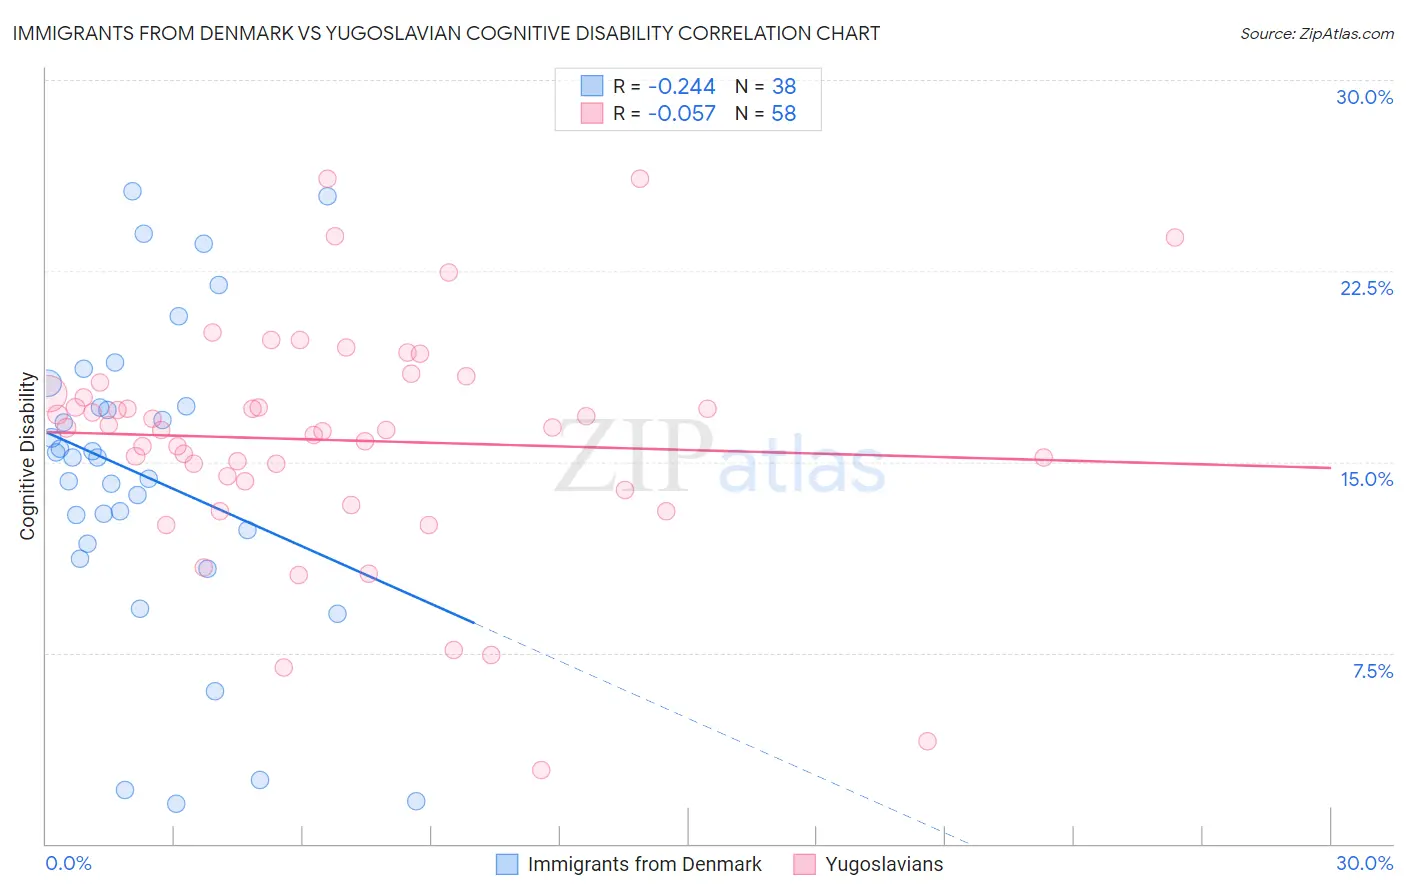
Immigrants from Denmark vs Yugoslavian Cognitive Disability Correlation Chart
The statistical analysis conducted on geographies consisting of 136,432,525 people shows a weak negative correlation between the proportion of Immigrants from Denmark and percentage of population with cognitive disability in the United States with a correlation coefficient (R) of -0.244 and weighted average of 16.9%. Similarly, the statistical analysis conducted on geographies consisting of 285,698,583 people shows a slight negative correlation between the proportion of Yugoslavians and percentage of population with cognitive disability in the United States with a correlation coefficient (R) of -0.057 and weighted average of 17.2%, a difference of 1.7%.
Cognitive Disability Correlation Summary
| Measurement | Immigrants from Denmark | Yugoslavian |
| Minimum | 1.6% | 2.9% |
| Maximum | 25.6% | 26.1% |
| Range | 24.1% | 23.2% |
| Mean | 14.4% | 15.9% |
| Median | 15.2% | 16.3% |
| Interquartile 25% (IQ1) | 11.8% | 14.3% |
| Interquartile 75% (IQ3) | 17.2% | 17.7% |
| Interquartile Range (IQR) | 5.4% | 3.4% |
| Standard Deviation (Sample) | 6.1% | 4.5% |
| Standard Deviation (Population) | 6.1% | 4.5% |
Similar Demographics by Cognitive Disability
Demographics Similar to Immigrants from Denmark by Cognitive Disability
In terms of cognitive disability, the demographic groups most similar to Immigrants from Denmark are Immigrants from Japan (16.9%, a difference of 0.010%), Inupiat (16.9%, a difference of 0.060%), South African (16.9%, a difference of 0.13%), Yup'ik (16.9%, a difference of 0.16%), and Immigrants from Sri Lanka (16.8%, a difference of 0.21%).
| Demographics | Rating | Rank | Cognitive Disability |
| Uruguayans | 97.2 /100 | #111 | Exceptional 16.8% |
| Indians (Asian) | 97.2 /100 | #112 | Exceptional 16.8% |
| Immigrants | Sri Lanka | 97.1 /100 | #113 | Exceptional 16.8% |
| Koreans | 97.1 /100 | #114 | Exceptional 16.8% |
| Yup'ik | 96.9 /100 | #115 | Exceptional 16.9% |
| Inupiat | 96.5 /100 | #116 | Exceptional 16.9% |
| Immigrants | Japan | 96.2 /100 | #117 | Exceptional 16.9% |
| Immigrants | Denmark | 96.2 /100 | #118 | Exceptional 16.9% |
| South Africans | 95.5 /100 | #119 | Exceptional 16.9% |
| Scottish | 95.0 /100 | #120 | Exceptional 16.9% |
| Immigrants | China | 94.9 /100 | #121 | Exceptional 16.9% |
| Immigrants | Western Europe | 94.8 /100 | #122 | Exceptional 16.9% |
| Portuguese | 94.7 /100 | #123 | Exceptional 16.9% |
| Turks | 94.5 /100 | #124 | Exceptional 16.9% |
| Scandinavians | 94.1 /100 | #125 | Exceptional 16.9% |
Demographics Similar to Yugoslavians by Cognitive Disability
In terms of cognitive disability, the demographic groups most similar to Yugoslavians are Immigrants from Switzerland (17.2%, a difference of 0.0%), American (17.2%, a difference of 0.020%), Australian (17.2%, a difference of 0.030%), Armenian (17.2%, a difference of 0.050%), and Immigrants from Latvia (17.2%, a difference of 0.060%).
| Demographics | Rating | Rank | Cognitive Disability |
| Brazilians | 78.9 /100 | #155 | Good 17.1% |
| Sri Lankans | 78.9 /100 | #156 | Good 17.1% |
| Immigrants | Australia | 76.0 /100 | #157 | Good 17.1% |
| Celtics | 74.1 /100 | #158 | Good 17.1% |
| Immigrants | Latvia | 73.2 /100 | #159 | Good 17.2% |
| Australians | 72.4 /100 | #160 | Good 17.2% |
| Americans | 72.2 /100 | #161 | Good 17.2% |
| Yugoslavians | 71.6 /100 | #162 | Good 17.2% |
| Immigrants | Switzerland | 71.5 /100 | #163 | Good 17.2% |
| Armenians | 70.1 /100 | #164 | Good 17.2% |
| Immigrants | Albania | 64.9 /100 | #165 | Good 17.2% |
| Immigrants | Ecuador | 64.4 /100 | #166 | Good 17.2% |
| Immigrants | Syria | 63.5 /100 | #167 | Good 17.2% |
| Immigrants | Immigrants | 62.5 /100 | #168 | Good 17.2% |
| Immigrants | Portugal | 61.8 /100 | #169 | Good 17.2% |