Iroquois vs Immigrants from Bangladesh Male Disability
COMPARE
Iroquois
Immigrants from Bangladesh
Male Disability
Male Disability Comparison
Iroquois
Immigrants from Bangladesh
13.6%
MALE DISABILITY
0.0/ 100
METRIC RATING
315th/ 347
METRIC RANK
10.3%
MALE DISABILITY
99.7/ 100
METRIC RATING
43rd/ 347
METRIC RANK
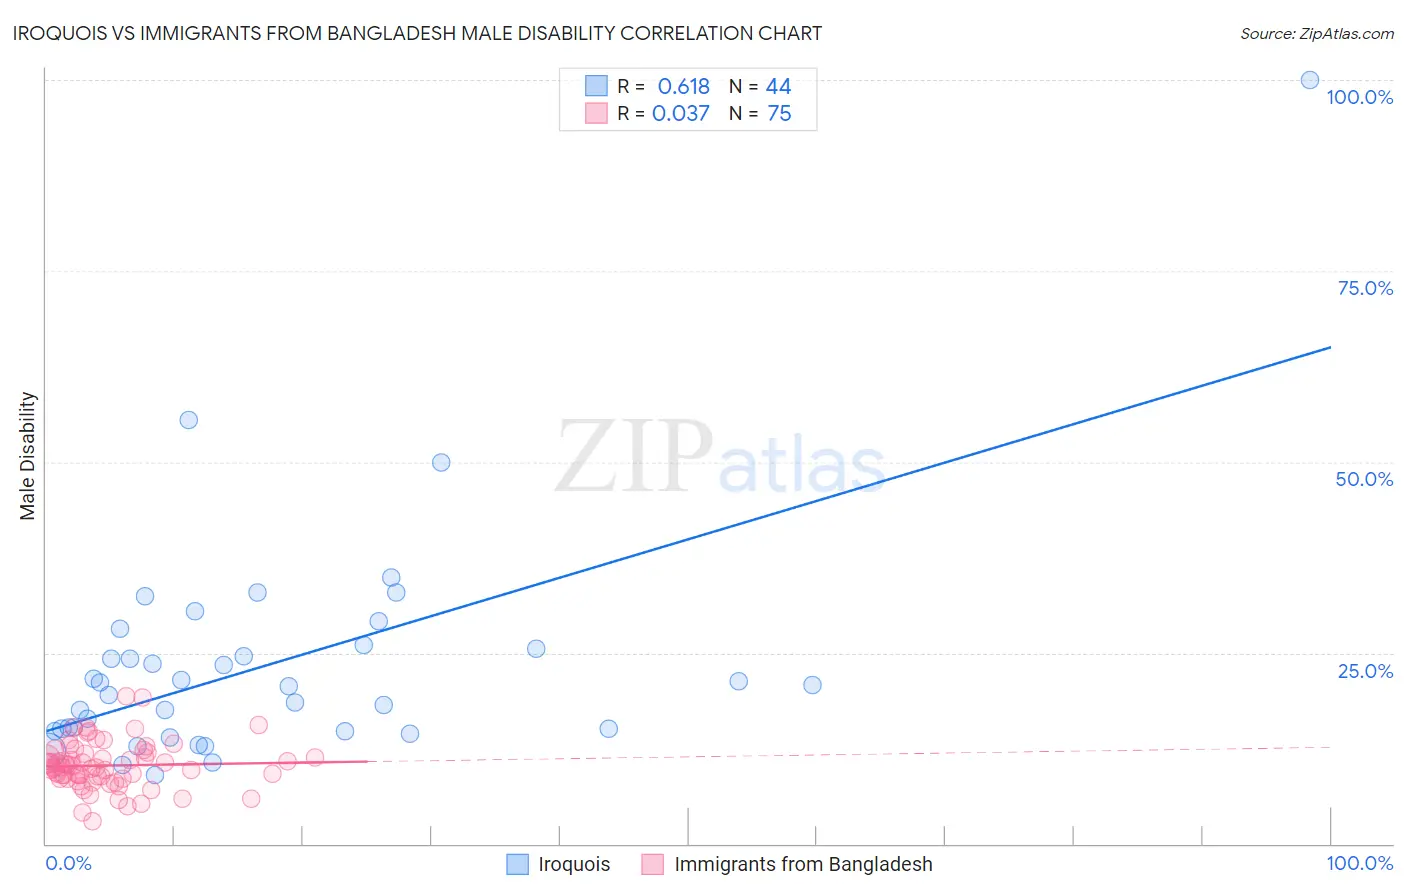
Iroquois vs Immigrants from Bangladesh Male Disability Correlation Chart
The statistical analysis conducted on geographies consisting of 207,273,711 people shows a significant positive correlation between the proportion of Iroquois and percentage of males with a disability in the United States with a correlation coefficient (R) of 0.618 and weighted average of 13.6%. Similarly, the statistical analysis conducted on geographies consisting of 203,673,842 people shows no correlation between the proportion of Immigrants from Bangladesh and percentage of males with a disability in the United States with a correlation coefficient (R) of 0.037 and weighted average of 10.3%, a difference of 31.8%.
Male Disability Correlation Summary
| Measurement | Iroquois | Immigrants from Bangladesh |
| Minimum | 9.0% | 2.9% |
| Maximum | 100.0% | 19.4% |
| Range | 91.0% | 16.5% |
| Mean | 23.4% | 10.3% |
| Median | 20.7% | 10.1% |
| Interquartile 25% (IQ1) | 14.9% | 8.6% |
| Interquartile 75% (IQ3) | 25.8% | 11.8% |
| Interquartile Range (IQR) | 11.0% | 3.2% |
| Standard Deviation (Sample) | 15.2% | 3.0% |
| Standard Deviation (Population) | 15.0% | 3.0% |
Similar Demographics by Male Disability
Demographics Similar to Iroquois by Male Disability
In terms of male disability, the demographic groups most similar to Iroquois are Alaska Native (13.6%, a difference of 0.050%), Aleut (13.5%, a difference of 0.16%), Puget Sound Salish (13.5%, a difference of 0.22%), Yakama (13.5%, a difference of 0.24%), and Delaware (13.5%, a difference of 0.79%).
| Demographics | Rating | Rank | Male Disability |
| French American Indians | 0.0 /100 | #308 | Tragic 13.4% |
| Blackfeet | 0.0 /100 | #309 | Tragic 13.4% |
| Immigrants | Azores | 0.0 /100 | #310 | Tragic 13.4% |
| Delaware | 0.0 /100 | #311 | Tragic 13.5% |
| Yakama | 0.0 /100 | #312 | Tragic 13.5% |
| Puget Sound Salish | 0.0 /100 | #313 | Tragic 13.5% |
| Aleuts | 0.0 /100 | #314 | Tragic 13.5% |
| Iroquois | 0.0 /100 | #315 | Tragic 13.6% |
| Alaska Natives | 0.0 /100 | #316 | Tragic 13.6% |
| Paiute | 0.0 /100 | #317 | Tragic 13.7% |
| Cree | 0.0 /100 | #318 | Tragic 13.7% |
| Americans | 0.0 /100 | #319 | Tragic 13.8% |
| Tlingit-Haida | 0.0 /100 | #320 | Tragic 13.8% |
| Shoshone | 0.0 /100 | #321 | Tragic 13.8% |
| Apache | 0.0 /100 | #322 | Tragic 14.0% |
Demographics Similar to Immigrants from Bangladesh by Male Disability
In terms of male disability, the demographic groups most similar to Immigrants from Bangladesh are Mongolian (10.3%, a difference of 0.020%), Immigrants from El Salvador (10.3%, a difference of 0.070%), Turkish (10.3%, a difference of 0.080%), Cambodian (10.3%, a difference of 0.16%), and Immigrants from Peru (10.3%, a difference of 0.19%).
| Demographics | Rating | Rank | Male Disability |
| Ethiopians | 99.8 /100 | #36 | Exceptional 10.2% |
| Immigrants | Indonesia | 99.8 /100 | #37 | Exceptional 10.2% |
| Immigrants | Kuwait | 99.8 /100 | #38 | Exceptional 10.2% |
| Afghans | 99.8 /100 | #39 | Exceptional 10.2% |
| Immigrants | Nepal | 99.8 /100 | #40 | Exceptional 10.3% |
| Taiwanese | 99.8 /100 | #41 | Exceptional 10.3% |
| Mongolians | 99.7 /100 | #42 | Exceptional 10.3% |
| Immigrants | Bangladesh | 99.7 /100 | #43 | Exceptional 10.3% |
| Immigrants | El Salvador | 99.7 /100 | #44 | Exceptional 10.3% |
| Turks | 99.7 /100 | #45 | Exceptional 10.3% |
| Cambodians | 99.7 /100 | #46 | Exceptional 10.3% |
| Immigrants | Peru | 99.7 /100 | #47 | Exceptional 10.3% |
| Israelis | 99.7 /100 | #48 | Exceptional 10.3% |
| Immigrants | Spain | 99.7 /100 | #49 | Exceptional 10.3% |
| South Americans | 99.6 /100 | #50 | Exceptional 10.3% |