Iroquois vs Immigrants from Cambodia Vision Disability
COMPARE
Iroquois
Immigrants from Cambodia
Vision Disability
Vision Disability Comparison
Iroquois
Immigrants from Cambodia
2.6%
VISION DISABILITY
0.0/ 100
METRIC RATING
306th/ 347
METRIC RANK
2.3%
VISION DISABILITY
1.1/ 100
METRIC RATING
238th/ 347
METRIC RANK
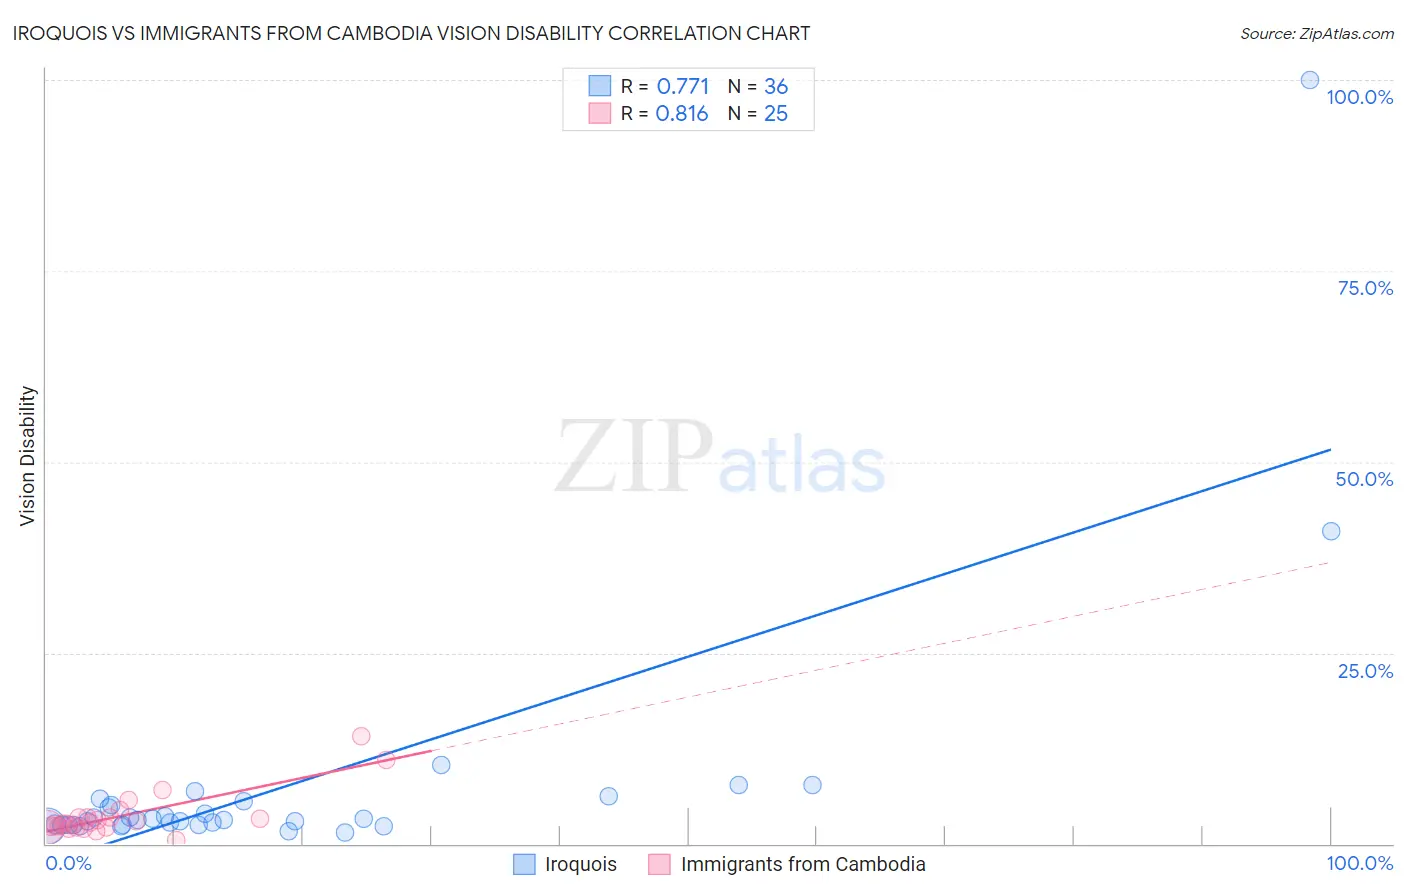
Iroquois vs Immigrants from Cambodia Vision Disability Correlation Chart
The statistical analysis conducted on geographies consisting of 207,187,482 people shows a strong positive correlation between the proportion of Iroquois and percentage of population with vision disability in the United States with a correlation coefficient (R) of 0.771 and weighted average of 2.6%. Similarly, the statistical analysis conducted on geographies consisting of 205,117,517 people shows a very strong positive correlation between the proportion of Immigrants from Cambodia and percentage of population with vision disability in the United States with a correlation coefficient (R) of 0.816 and weighted average of 2.3%, a difference of 12.5%.
Vision Disability Correlation Summary
| Measurement | Iroquois | Immigrants from Cambodia |
| Minimum | 1.5% | 0.43% |
| Maximum | 100.0% | 14.1% |
| Range | 98.5% | 13.7% |
| Mean | 7.5% | 3.7% |
| Median | 3.1% | 2.6% |
| Interquartile 25% (IQ1) | 2.4% | 2.2% |
| Interquartile 75% (IQ3) | 5.3% | 3.5% |
| Interquartile Range (IQR) | 2.9% | 1.3% |
| Standard Deviation (Sample) | 17.1% | 3.0% |
| Standard Deviation (Population) | 16.9% | 2.9% |
Similar Demographics by Vision Disability
Demographics Similar to Iroquois by Vision Disability
In terms of vision disability, the demographic groups most similar to Iroquois are Immigrants from Dominican Republic (2.6%, a difference of 0.020%), Arapaho (2.6%, a difference of 0.040%), Immigrants from Yemen (2.6%, a difference of 0.33%), Hispanic or Latino (2.6%, a difference of 0.61%), and Blackfeet (2.6%, a difference of 0.65%).
| Demographics | Rating | Rank | Vision Disability |
| Cree | 0.0 /100 | #299 | Tragic 2.5% |
| Africans | 0.0 /100 | #300 | Tragic 2.5% |
| Menominee | 0.0 /100 | #301 | Tragic 2.5% |
| Spanish American Indians | 0.0 /100 | #302 | Tragic 2.6% |
| Immigrants | Cabo Verde | 0.0 /100 | #303 | Tragic 2.6% |
| Aleuts | 0.0 /100 | #304 | Tragic 2.6% |
| Hispanics or Latinos | 0.0 /100 | #305 | Tragic 2.6% |
| Iroquois | 0.0 /100 | #306 | Tragic 2.6% |
| Immigrants | Dominican Republic | 0.0 /100 | #307 | Tragic 2.6% |
| Arapaho | 0.0 /100 | #308 | Tragic 2.6% |
| Immigrants | Yemen | 0.0 /100 | #309 | Tragic 2.6% |
| Blackfeet | 0.0 /100 | #310 | Tragic 2.6% |
| Dominicans | 0.0 /100 | #311 | Tragic 2.6% |
| Americans | 0.0 /100 | #312 | Tragic 2.6% |
| Potawatomi | 0.0 /100 | #313 | Tragic 2.6% |
Demographics Similar to Immigrants from Cambodia by Vision Disability
In terms of vision disability, the demographic groups most similar to Immigrants from Cambodia are English (2.3%, a difference of 0.020%), Immigrants from Portugal (2.3%, a difference of 0.27%), Panamanian (2.3%, a difference of 0.27%), Malaysian (2.3%, a difference of 0.30%), and Immigrants from Congo (2.3%, a difference of 0.32%).
| Demographics | Rating | Rank | Vision Disability |
| Immigrants | Ecuador | 2.0 /100 | #231 | Tragic 2.3% |
| German Russians | 1.8 /100 | #232 | Tragic 2.3% |
| Central Americans | 1.8 /100 | #233 | Tragic 2.3% |
| Scottish | 1.6 /100 | #234 | Tragic 2.3% |
| Marshallese | 1.5 /100 | #235 | Tragic 2.3% |
| Immigrants | Congo | 1.4 /100 | #236 | Tragic 2.3% |
| Immigrants | Portugal | 1.4 /100 | #237 | Tragic 2.3% |
| Immigrants | Cambodia | 1.1 /100 | #238 | Tragic 2.3% |
| English | 1.1 /100 | #239 | Tragic 2.3% |
| Panamanians | 0.9 /100 | #240 | Tragic 2.3% |
| Malaysians | 0.9 /100 | #241 | Tragic 2.3% |
| Immigrants | Panama | 0.8 /100 | #242 | Tragic 2.3% |
| Immigrants | Nicaragua | 0.6 /100 | #243 | Tragic 2.3% |
| Immigrants | West Indies | 0.6 /100 | #244 | Tragic 2.3% |
| Alsatians | 0.6 /100 | #245 | Tragic 2.3% |