Iroquois vs Immigrants from Zimbabwe Vision Disability
COMPARE
Iroquois
Immigrants from Zimbabwe
Vision Disability
Vision Disability Comparison
Iroquois
Immigrants from Zimbabwe
2.6%
VISION DISABILITY
0.0/ 100
METRIC RATING
306th/ 347
METRIC RANK
2.1%
VISION DISABILITY
91.0/ 100
METRIC RATING
120th/ 347
METRIC RANK
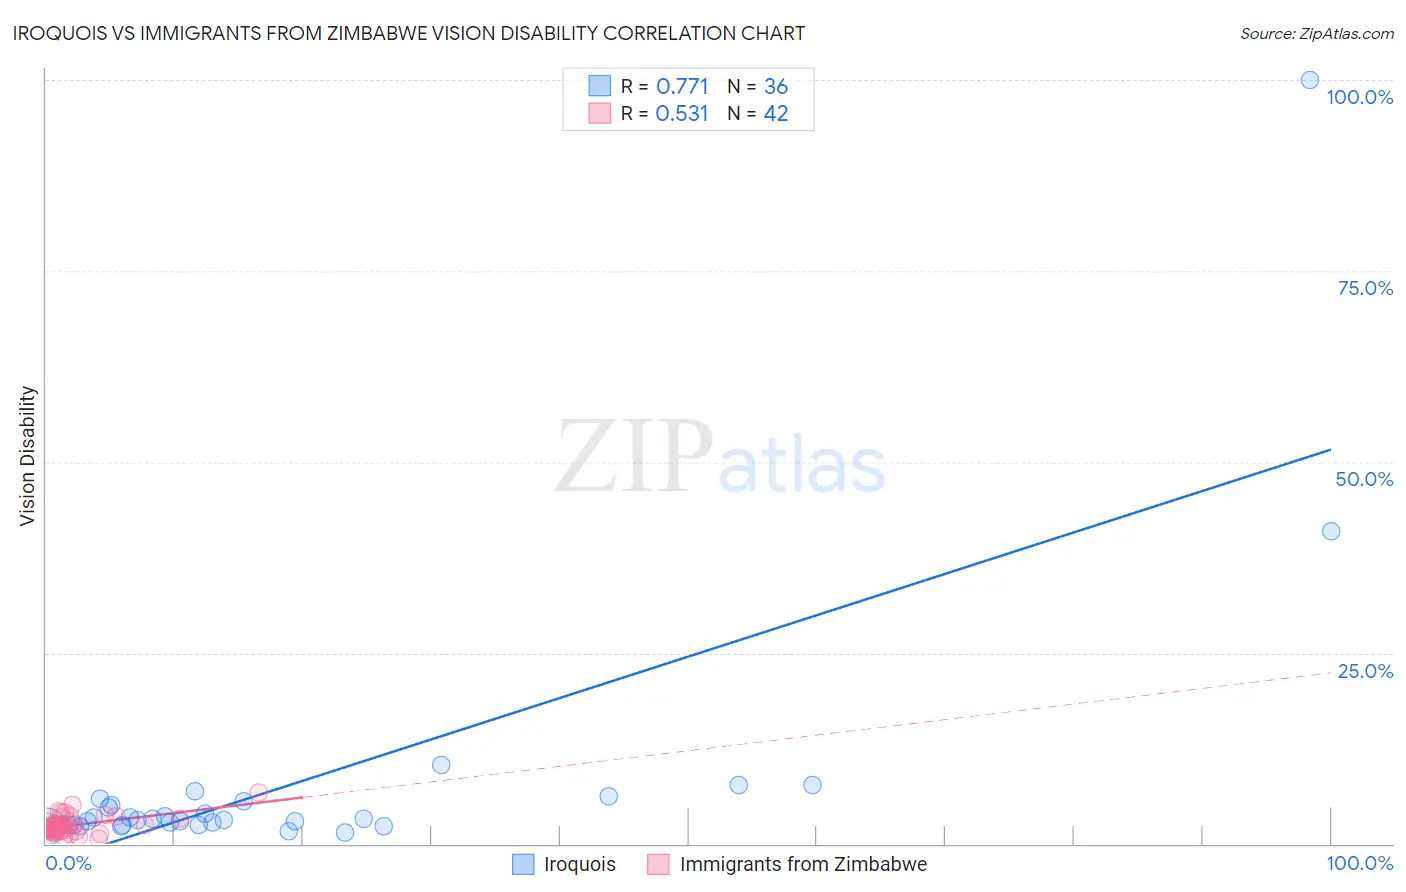
Iroquois vs Immigrants from Zimbabwe Vision Disability Correlation Chart
The statistical analysis conducted on geographies consisting of 207,187,482 people shows a strong positive correlation between the proportion of Iroquois and percentage of population with vision disability in the United States with a correlation coefficient (R) of 0.771 and weighted average of 2.6%. Similarly, the statistical analysis conducted on geographies consisting of 117,800,208 people shows a substantial positive correlation between the proportion of Immigrants from Zimbabwe and percentage of population with vision disability in the United States with a correlation coefficient (R) of 0.531 and weighted average of 2.1%, a difference of 25.0%.
Vision Disability Correlation Summary
| Measurement | Iroquois | Immigrants from Zimbabwe |
| Minimum | 1.5% | 0.59% |
| Maximum | 100.0% | 6.8% |
| Range | 98.5% | 6.2% |
| Mean | 7.5% | 2.4% |
| Median | 3.1% | 2.1% |
| Interquartile 25% (IQ1) | 2.4% | 1.7% |
| Interquartile 75% (IQ3) | 5.3% | 2.6% |
| Interquartile Range (IQR) | 2.9% | 0.89% |
| Standard Deviation (Sample) | 17.1% | 1.2% |
| Standard Deviation (Population) | 16.9% | 1.2% |
Similar Demographics by Vision Disability
Demographics Similar to Iroquois by Vision Disability
In terms of vision disability, the demographic groups most similar to Iroquois are Immigrants from Dominican Republic (2.6%, a difference of 0.020%), Arapaho (2.6%, a difference of 0.040%), Immigrants from Yemen (2.6%, a difference of 0.33%), Hispanic or Latino (2.6%, a difference of 0.61%), and Blackfeet (2.6%, a difference of 0.65%).
| Demographics | Rating | Rank | Vision Disability |
| Cree | 0.0 /100 | #299 | Tragic 2.5% |
| Africans | 0.0 /100 | #300 | Tragic 2.5% |
| Menominee | 0.0 /100 | #301 | Tragic 2.5% |
| Spanish American Indians | 0.0 /100 | #302 | Tragic 2.6% |
| Immigrants | Cabo Verde | 0.0 /100 | #303 | Tragic 2.6% |
| Aleuts | 0.0 /100 | #304 | Tragic 2.6% |
| Hispanics or Latinos | 0.0 /100 | #305 | Tragic 2.6% |
| Iroquois | 0.0 /100 | #306 | Tragic 2.6% |
| Immigrants | Dominican Republic | 0.0 /100 | #307 | Tragic 2.6% |
| Arapaho | 0.0 /100 | #308 | Tragic 2.6% |
| Immigrants | Yemen | 0.0 /100 | #309 | Tragic 2.6% |
| Blackfeet | 0.0 /100 | #310 | Tragic 2.6% |
| Dominicans | 0.0 /100 | #311 | Tragic 2.6% |
| Americans | 0.0 /100 | #312 | Tragic 2.6% |
| Potawatomi | 0.0 /100 | #313 | Tragic 2.6% |
Demographics Similar to Immigrants from Zimbabwe by Vision Disability
In terms of vision disability, the demographic groups most similar to Immigrants from Zimbabwe are Immigrants from Uganda (2.1%, a difference of 0.060%), Immigrants from Philippines (2.1%, a difference of 0.070%), Immigrants from Scotland (2.1%, a difference of 0.12%), Immigrants from Ukraine (2.1%, a difference of 0.13%), and Immigrants from Albania (2.1%, a difference of 0.13%).
| Demographics | Rating | Rank | Vision Disability |
| Kenyans | 92.5 /100 | #113 | Exceptional 2.1% |
| Croatians | 92.3 /100 | #114 | Exceptional 2.1% |
| Immigrants | Vietnam | 92.2 /100 | #115 | Exceptional 2.1% |
| Ugandans | 92.2 /100 | #116 | Exceptional 2.1% |
| Poles | 92.0 /100 | #117 | Exceptional 2.1% |
| Immigrants | Philippines | 91.4 /100 | #118 | Exceptional 2.1% |
| Immigrants | Uganda | 91.4 /100 | #119 | Exceptional 2.1% |
| Immigrants | Zimbabwe | 91.0 /100 | #120 | Exceptional 2.1% |
| Immigrants | Scotland | 90.4 /100 | #121 | Exceptional 2.1% |
| Immigrants | Ukraine | 90.4 /100 | #122 | Exceptional 2.1% |
| Immigrants | Albania | 90.4 /100 | #123 | Exceptional 2.1% |
| Immigrants | Spain | 89.8 /100 | #124 | Excellent 2.1% |
| Immigrants | Venezuela | 89.8 /100 | #125 | Excellent 2.1% |
| Immigrants | Peru | 89.5 /100 | #126 | Excellent 2.1% |
| Sudanese | 89.2 /100 | #127 | Excellent 2.1% |