Irish vs Immigrants from Uganda Vision Disability
COMPARE
Irish
Immigrants from Uganda
Vision Disability
Vision Disability Comparison
Irish
Immigrants from Uganda
2.3%
VISION DISABILITY
3.4/ 100
METRIC RATING
224th/ 347
METRIC RANK
2.1%
VISION DISABILITY
91.4/ 100
METRIC RATING
119th/ 347
METRIC RANK
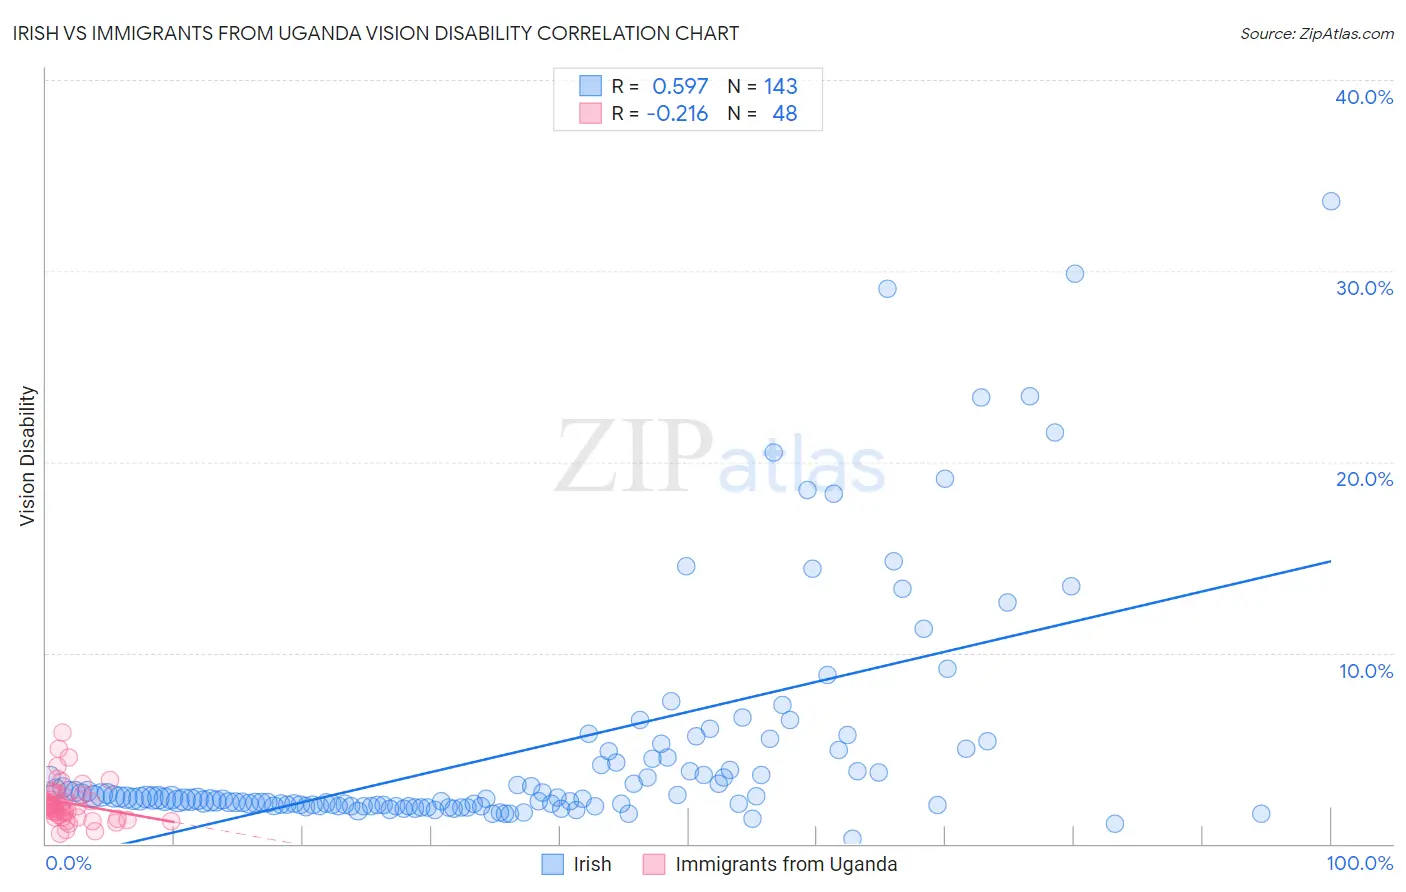
Irish vs Immigrants from Uganda Vision Disability Correlation Chart
The statistical analysis conducted on geographies consisting of 577,659,989 people shows a substantial positive correlation between the proportion of Irish and percentage of population with vision disability in the United States with a correlation coefficient (R) of 0.597 and weighted average of 2.3%. Similarly, the statistical analysis conducted on geographies consisting of 125,949,603 people shows a weak negative correlation between the proportion of Immigrants from Uganda and percentage of population with vision disability in the United States with a correlation coefficient (R) of -0.216 and weighted average of 2.1%, a difference of 9.3%.
Vision Disability Correlation Summary
| Measurement | Irish | Immigrants from Uganda |
| Minimum | 0.27% | 0.52% |
| Maximum | 33.6% | 5.8% |
| Range | 33.4% | 5.3% |
| Mean | 4.9% | 2.1% |
| Median | 2.4% | 2.0% |
| Interquartile 25% (IQ1) | 2.0% | 1.4% |
| Interquartile 75% (IQ3) | 4.4% | 2.4% |
| Interquartile Range (IQR) | 2.4% | 0.99% |
| Standard Deviation (Sample) | 6.0% | 1.1% |
| Standard Deviation (Population) | 6.0% | 1.1% |
Similar Demographics by Vision Disability
Demographics Similar to Irish by Vision Disability
In terms of vision disability, the demographic groups most similar to Irish are Immigrants from Western Africa (2.3%, a difference of 0.010%), Basque (2.3%, a difference of 0.020%), Immigrants from Senegal (2.3%, a difference of 0.17%), French Canadian (2.3%, a difference of 0.19%), and Guamanian/Chamorro (2.3%, a difference of 0.20%).
| Demographics | Rating | Rank | Vision Disability |
| Barbadians | 5.1 /100 | #217 | Tragic 2.3% |
| Portuguese | 4.9 /100 | #218 | Tragic 2.3% |
| Ecuadorians | 4.6 /100 | #219 | Tragic 2.3% |
| Guamanians/Chamorros | 3.9 /100 | #220 | Tragic 2.3% |
| French Canadians | 3.9 /100 | #221 | Tragic 2.3% |
| Immigrants | Senegal | 3.8 /100 | #222 | Tragic 2.3% |
| Basques | 3.5 /100 | #223 | Tragic 2.3% |
| Irish | 3.4 /100 | #224 | Tragic 2.3% |
| Immigrants | Western Africa | 3.4 /100 | #225 | Tragic 2.3% |
| Immigrants | Germany | 3.0 /100 | #226 | Tragic 2.3% |
| Hawaiians | 2.9 /100 | #227 | Tragic 2.3% |
| Hmong | 2.5 /100 | #228 | Tragic 2.3% |
| Welsh | 2.3 /100 | #229 | Tragic 2.3% |
| Nicaraguans | 2.2 /100 | #230 | Tragic 2.3% |
| Immigrants | Ecuador | 2.0 /100 | #231 | Tragic 2.3% |
Demographics Similar to Immigrants from Uganda by Vision Disability
In terms of vision disability, the demographic groups most similar to Immigrants from Uganda are Immigrants from Philippines (2.1%, a difference of 0.0%), Immigrants from Zimbabwe (2.1%, a difference of 0.060%), Polish (2.1%, a difference of 0.14%), Ugandan (2.1%, a difference of 0.18%), and Immigrants from Vietnam (2.1%, a difference of 0.19%).
| Demographics | Rating | Rank | Vision Disability |
| Immigrants | Denmark | 92.9 /100 | #112 | Exceptional 2.1% |
| Kenyans | 92.5 /100 | #113 | Exceptional 2.1% |
| Croatians | 92.3 /100 | #114 | Exceptional 2.1% |
| Immigrants | Vietnam | 92.2 /100 | #115 | Exceptional 2.1% |
| Ugandans | 92.2 /100 | #116 | Exceptional 2.1% |
| Poles | 92.0 /100 | #117 | Exceptional 2.1% |
| Immigrants | Philippines | 91.4 /100 | #118 | Exceptional 2.1% |
| Immigrants | Uganda | 91.4 /100 | #119 | Exceptional 2.1% |
| Immigrants | Zimbabwe | 91.0 /100 | #120 | Exceptional 2.1% |
| Immigrants | Scotland | 90.4 /100 | #121 | Exceptional 2.1% |
| Immigrants | Ukraine | 90.4 /100 | #122 | Exceptional 2.1% |
| Immigrants | Albania | 90.4 /100 | #123 | Exceptional 2.1% |
| Immigrants | Spain | 89.8 /100 | #124 | Excellent 2.1% |
| Immigrants | Venezuela | 89.8 /100 | #125 | Excellent 2.1% |
| Immigrants | Peru | 89.5 /100 | #126 | Excellent 2.1% |