Iraqi vs U.S. Virgin Islander Hearing Disability
COMPARE
Iraqi
U.S. Virgin Islander
Hearing Disability
Hearing Disability Comparison
Iraqis
U.S. Virgin Islanders
3.1%
HEARING DISABILITY
19.0/ 100
METRIC RATING
201st/ 347
METRIC RANK
2.8%
HEARING DISABILITY
92.5/ 100
METRIC RATING
112th/ 347
METRIC RANK
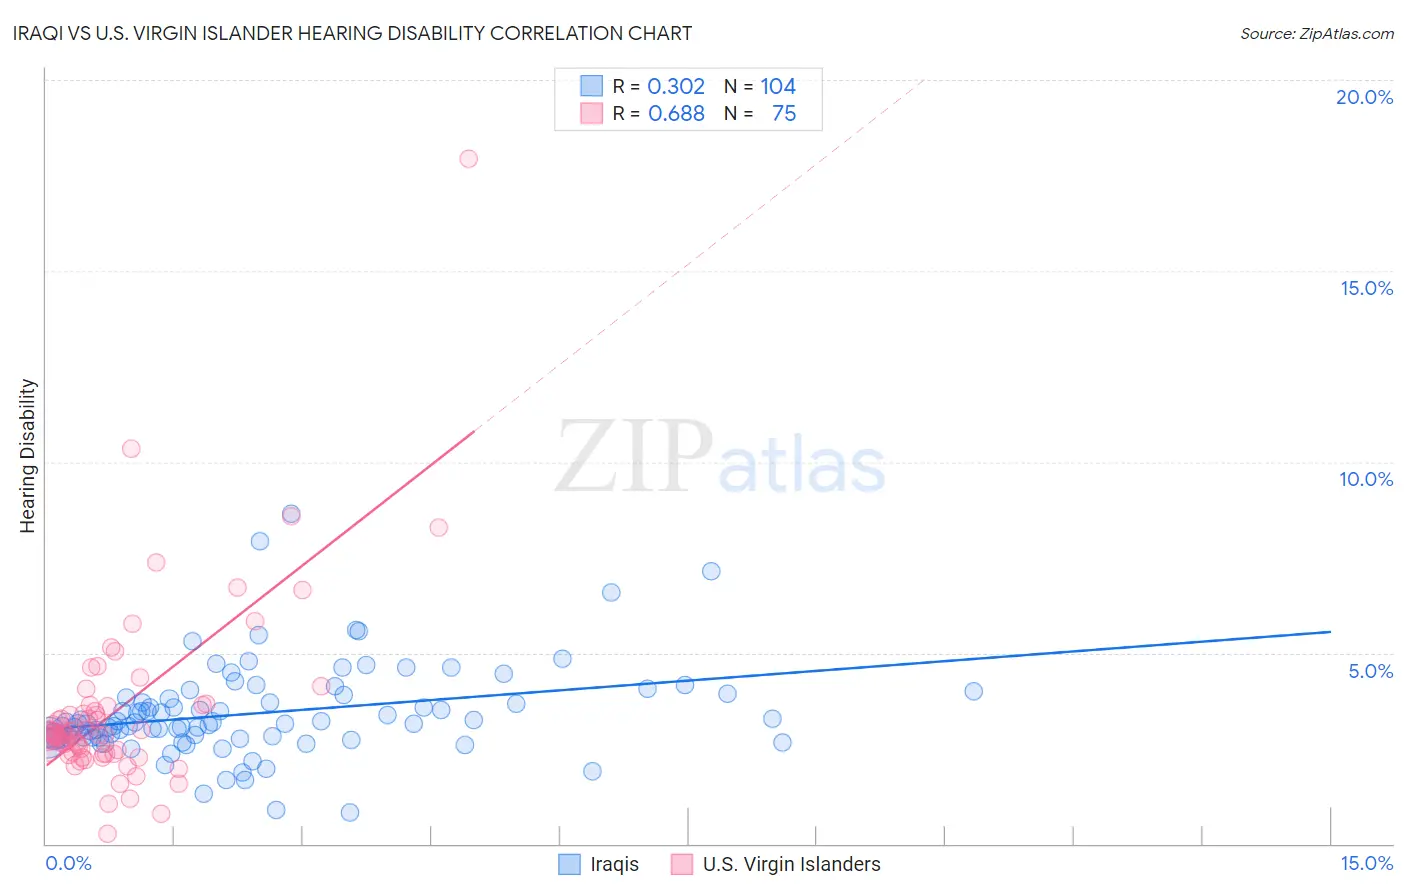
Iraqi vs U.S. Virgin Islander Hearing Disability Correlation Chart
The statistical analysis conducted on geographies consisting of 170,639,688 people shows a mild positive correlation between the proportion of Iraqis and percentage of population with hearing disability in the United States with a correlation coefficient (R) of 0.302 and weighted average of 3.1%. Similarly, the statistical analysis conducted on geographies consisting of 87,522,963 people shows a significant positive correlation between the proportion of U.S. Virgin Islanders and percentage of population with hearing disability in the United States with a correlation coefficient (R) of 0.688 and weighted average of 2.8%, a difference of 9.9%.
Hearing Disability Correlation Summary
| Measurement | Iraqi | U.S. Virgin Islander |
| Minimum | 0.83% | 0.26% |
| Maximum | 8.7% | 17.9% |
| Range | 7.8% | 17.7% |
| Mean | 3.4% | 3.5% |
| Median | 3.1% | 2.9% |
| Interquartile 25% (IQ1) | 2.8% | 2.4% |
| Interquartile 75% (IQ3) | 3.9% | 3.6% |
| Interquartile Range (IQR) | 1.1% | 1.3% |
| Standard Deviation (Sample) | 1.2% | 2.4% |
| Standard Deviation (Population) | 1.2% | 2.4% |
Similar Demographics by Hearing Disability
Demographics Similar to Iraqis by Hearing Disability
In terms of hearing disability, the demographic groups most similar to Iraqis are Immigrants from North Macedonia (3.1%, a difference of 0.020%), Syrian (3.1%, a difference of 0.030%), Immigrants from Croatia (3.1%, a difference of 0.22%), Immigrants from Bosnia and Herzegovina (3.1%, a difference of 0.24%), and Immigrants from Thailand (3.1%, a difference of 0.40%).
| Demographics | Rating | Rank | Hearing Disability |
| South Africans | 24.5 /100 | #194 | Fair 3.1% |
| Spanish American Indians | 24.1 /100 | #195 | Fair 3.1% |
| Immigrants | Europe | 22.9 /100 | #196 | Fair 3.1% |
| Immigrants | Bosnia and Herzegovina | 20.6 /100 | #197 | Fair 3.1% |
| Immigrants | Croatia | 20.5 /100 | #198 | Fair 3.1% |
| Syrians | 19.2 /100 | #199 | Poor 3.1% |
| Immigrants | North Macedonia | 19.1 /100 | #200 | Poor 3.1% |
| Iraqis | 19.0 /100 | #201 | Poor 3.1% |
| Immigrants | Thailand | 16.4 /100 | #202 | Poor 3.1% |
| Immigrants | Denmark | 16.2 /100 | #203 | Poor 3.1% |
| Immigrants | Czechoslovakia | 15.9 /100 | #204 | Poor 3.1% |
| Alsatians | 15.9 /100 | #205 | Poor 3.1% |
| Eastern Europeans | 15.5 /100 | #206 | Poor 3.1% |
| Hispanics or Latinos | 15.1 /100 | #207 | Poor 3.1% |
| Immigrants | Latvia | 12.7 /100 | #208 | Poor 3.1% |
Demographics Similar to U.S. Virgin Islanders by Hearing Disability
In terms of hearing disability, the demographic groups most similar to U.S. Virgin Islanders are Immigrants from Yemen (2.8%, a difference of 0.070%), Cypriot (2.8%, a difference of 0.12%), Turkish (2.8%, a difference of 0.17%), Guatemalan (2.8%, a difference of 0.24%), and Immigrants from Belarus (2.8%, a difference of 0.31%).
| Demographics | Rating | Rank | Hearing Disability |
| Moroccans | 93.9 /100 | #105 | Exceptional 2.8% |
| Hondurans | 93.4 /100 | #106 | Exceptional 2.8% |
| Immigrants | Chile | 93.4 /100 | #107 | Exceptional 2.8% |
| Guatemalans | 93.2 /100 | #108 | Exceptional 2.8% |
| Turks | 93.0 /100 | #109 | Exceptional 2.8% |
| Cypriots | 92.9 /100 | #110 | Exceptional 2.8% |
| Immigrants | Yemen | 92.7 /100 | #111 | Exceptional 2.8% |
| U.S. Virgin Islanders | 92.5 /100 | #112 | Exceptional 2.8% |
| Immigrants | Belarus | 91.6 /100 | #113 | Exceptional 2.8% |
| Cambodians | 91.1 /100 | #114 | Exceptional 2.8% |
| Immigrants | Latin America | 90.5 /100 | #115 | Exceptional 2.8% |
| Immigrants | Immigrants | 90.3 /100 | #116 | Exceptional 2.8% |
| Immigrants | Liberia | 90.0 /100 | #117 | Excellent 2.8% |
| Zimbabweans | 89.9 /100 | #118 | Excellent 2.8% |
| Kenyans | 89.8 /100 | #119 | Excellent 2.8% |