Iraqi vs Immigrants from Switzerland Male Unemployment
COMPARE
Iraqi
Immigrants from Switzerland
Male Unemployment
Male Unemployment Comparison
Iraqis
Immigrants from Switzerland
5.4%
MALE UNEMPLOYMENT
31.6/ 100
METRIC RATING
186th/ 347
METRIC RANK
5.2%
MALE UNEMPLOYMENT
79.2/ 100
METRIC RATING
141st/ 347
METRIC RANK
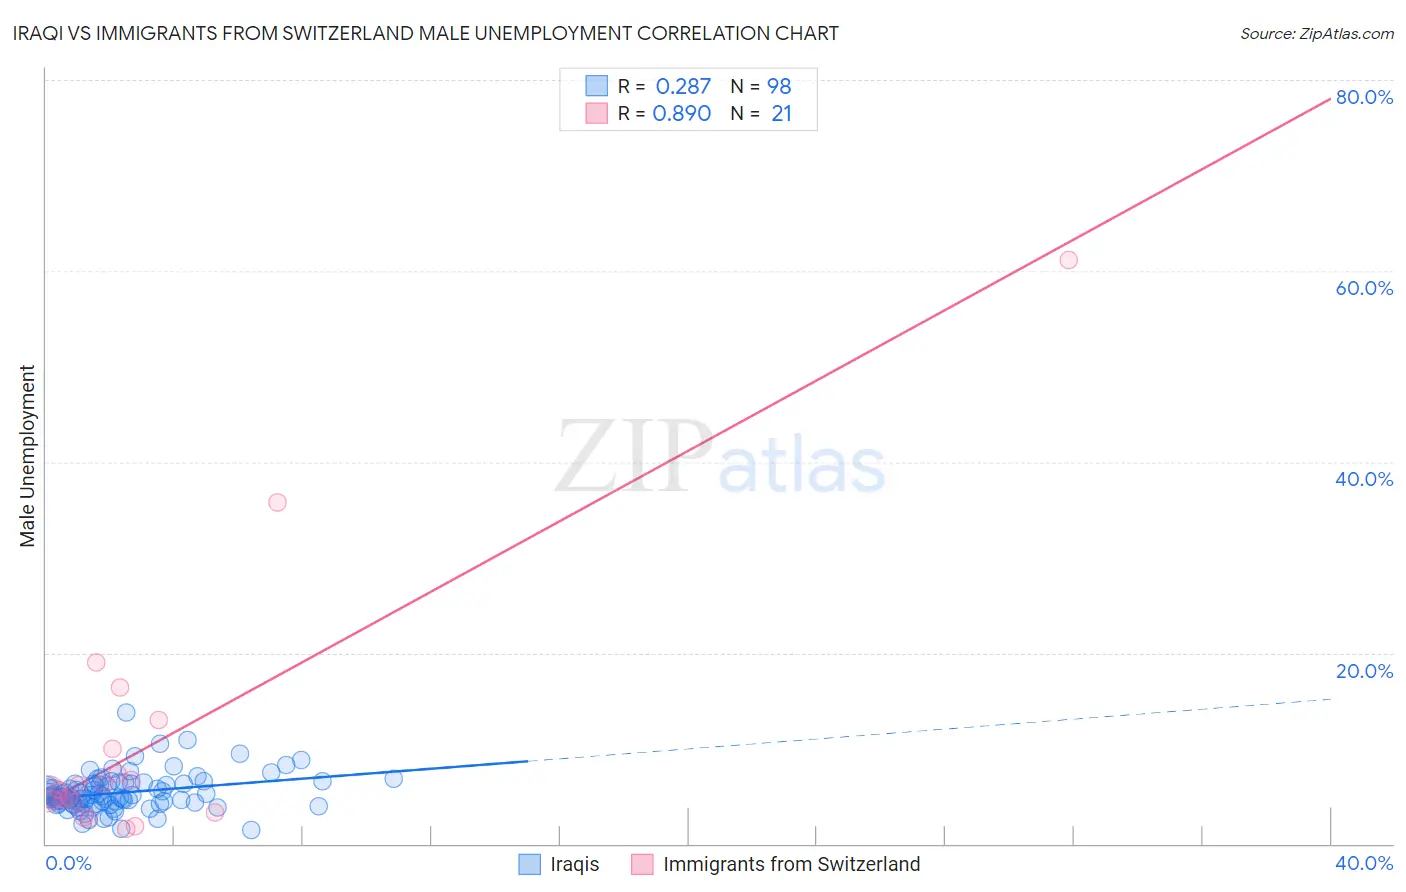
Iraqi vs Immigrants from Switzerland Male Unemployment Correlation Chart
The statistical analysis conducted on geographies consisting of 170,532,331 people shows a weak positive correlation between the proportion of Iraqis and unemployment rate among males in the United States with a correlation coefficient (R) of 0.287 and weighted average of 5.4%. Similarly, the statistical analysis conducted on geographies consisting of 147,847,273 people shows a very strong positive correlation between the proportion of Immigrants from Switzerland and unemployment rate among males in the United States with a correlation coefficient (R) of 0.890 and weighted average of 5.2%, a difference of 3.2%.
Male Unemployment Correlation Summary
| Measurement | Iraqi | Immigrants from Switzerland |
| Minimum | 1.4% | 1.6% |
| Maximum | 13.8% | 61.1% |
| Range | 12.4% | 59.5% |
| Mean | 5.4% | 10.6% |
| Median | 4.9% | 5.6% |
| Interquartile 25% (IQ1) | 4.2% | 3.8% |
| Interquartile 75% (IQ3) | 6.3% | 11.5% |
| Interquartile Range (IQR) | 2.1% | 7.7% |
| Standard Deviation (Sample) | 1.9% | 13.9% |
| Standard Deviation (Population) | 1.9% | 13.6% |
Similar Demographics by Male Unemployment
Demographics Similar to Iraqis by Male Unemployment
In terms of male unemployment, the demographic groups most similar to Iraqis are Costa Rican (5.4%, a difference of 0.010%), Arab (5.4%, a difference of 0.090%), Immigrants from South America (5.4%, a difference of 0.15%), Immigrants from Uganda (5.4%, a difference of 0.19%), and Korean (5.3%, a difference of 0.22%).
| Demographics | Rating | Rank | Male Unemployment |
| Immigrants | Oceania | 40.8 /100 | #179 | Average 5.3% |
| Malaysians | 39.6 /100 | #180 | Fair 5.3% |
| Immigrants | Afghanistan | 37.9 /100 | #181 | Fair 5.3% |
| Potawatomi | 37.8 /100 | #182 | Fair 5.3% |
| Taiwanese | 37.6 /100 | #183 | Fair 5.3% |
| Spaniards | 35.1 /100 | #184 | Fair 5.3% |
| Koreans | 34.9 /100 | #185 | Fair 5.3% |
| Iraqis | 31.6 /100 | #186 | Fair 5.4% |
| Costa Ricans | 31.3 /100 | #187 | Fair 5.4% |
| Arabs | 30.2 /100 | #188 | Fair 5.4% |
| Immigrants | South America | 29.4 /100 | #189 | Fair 5.4% |
| Immigrants | Uganda | 28.8 /100 | #190 | Fair 5.4% |
| Immigrants | South Eastern Asia | 28.2 /100 | #191 | Fair 5.4% |
| Immigrants | Belarus | 26.0 /100 | #192 | Fair 5.4% |
| Immigrants | Israel | 25.2 /100 | #193 | Fair 5.4% |
Demographics Similar to Immigrants from Switzerland by Male Unemployment
In terms of male unemployment, the demographic groups most similar to Immigrants from Switzerland are Brazilian (5.2%, a difference of 0.010%), Kenyan (5.2%, a difference of 0.020%), Immigrants from Croatia (5.2%, a difference of 0.040%), Immigrants from Eastern Africa (5.2%, a difference of 0.050%), and Lebanese (5.2%, a difference of 0.060%).
| Demographics | Rating | Rank | Male Unemployment |
| Pakistanis | 80.5 /100 | #134 | Excellent 5.2% |
| Immigrants | Saudi Arabia | 80.1 /100 | #135 | Excellent 5.2% |
| Lebanese | 79.9 /100 | #136 | Good 5.2% |
| Immigrants | Eastern Africa | 79.8 /100 | #137 | Good 5.2% |
| Immigrants | Croatia | 79.7 /100 | #138 | Good 5.2% |
| Kenyans | 79.4 /100 | #139 | Good 5.2% |
| Brazilians | 79.3 /100 | #140 | Good 5.2% |
| Immigrants | Switzerland | 79.2 /100 | #141 | Good 5.2% |
| Fijians | 78.3 /100 | #142 | Good 5.2% |
| Syrians | 78.0 /100 | #143 | Good 5.2% |
| Sri Lankans | 77.9 /100 | #144 | Good 5.2% |
| Macedonians | 77.7 /100 | #145 | Good 5.2% |
| Immigrants | Kenya | 77.6 /100 | #146 | Good 5.2% |
| Immigrants | Burma/Myanmar | 77.5 /100 | #147 | Good 5.2% |
| Immigrants | Italy | 76.3 /100 | #148 | Good 5.2% |