Iraqi vs Immigrants from France Female Disability
COMPARE
Iraqi
Immigrants from France
Female Disability
Female Disability Comparison
Iraqis
Immigrants from France
12.3%
FEMALE DISABILITY
36.0/ 100
METRIC RATING
184th/ 347
METRIC RANK
11.4%
FEMALE DISABILITY
99.9/ 100
METRIC RATING
61st/ 347
METRIC RANK
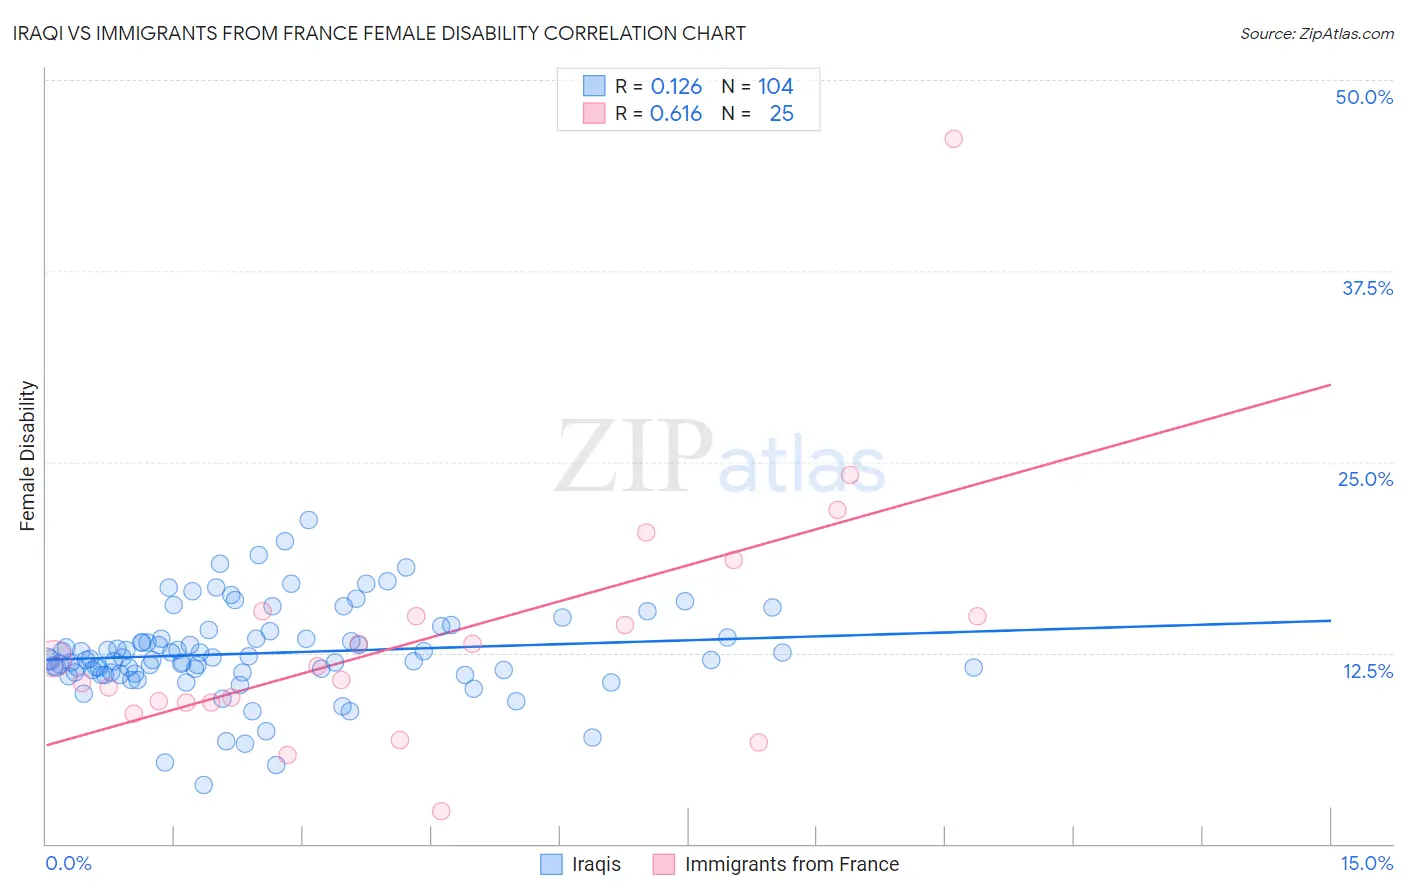
Iraqi vs Immigrants from France Female Disability Correlation Chart
The statistical analysis conducted on geographies consisting of 170,640,782 people shows a poor positive correlation between the proportion of Iraqis and percentage of females with a disability in the United States with a correlation coefficient (R) of 0.126 and weighted average of 12.3%. Similarly, the statistical analysis conducted on geographies consisting of 287,899,826 people shows a significant positive correlation between the proportion of Immigrants from France and percentage of females with a disability in the United States with a correlation coefficient (R) of 0.616 and weighted average of 11.4%, a difference of 7.5%.
Female Disability Correlation Summary
| Measurement | Iraqi | Immigrants from France |
| Minimum | 3.8% | 2.1% |
| Maximum | 21.2% | 46.2% |
| Range | 17.3% | 44.1% |
| Mean | 12.5% | 13.6% |
| Median | 12.1% | 11.7% |
| Interquartile 25% (IQ1) | 11.2% | 9.3% |
| Interquartile 75% (IQ3) | 13.5% | 15.0% |
| Interquartile Range (IQR) | 2.3% | 5.8% |
| Standard Deviation (Sample) | 3.0% | 8.5% |
| Standard Deviation (Population) | 2.9% | 8.3% |
Similar Demographics by Female Disability
Demographics Similar to Iraqis by Female Disability
In terms of female disability, the demographic groups most similar to Iraqis are Cuban (12.3%, a difference of 0.020%), Norwegian (12.3%, a difference of 0.040%), Immigrants from Canada (12.3%, a difference of 0.050%), Albanian (12.3%, a difference of 0.080%), and Immigrants from Uzbekistan (12.3%, a difference of 0.080%).
| Demographics | Rating | Rank | Female Disability |
| Immigrants | Ghana | 42.5 /100 | #177 | Average 12.2% |
| Immigrants | Western Europe | 40.9 /100 | #178 | Average 12.2% |
| Immigrants | Fiji | 38.2 /100 | #179 | Fair 12.3% |
| Albanians | 37.9 /100 | #180 | Fair 12.3% |
| Immigrants | Canada | 37.2 /100 | #181 | Fair 12.3% |
| Norwegians | 36.9 /100 | #182 | Fair 12.3% |
| Cubans | 36.5 /100 | #183 | Fair 12.3% |
| Iraqis | 36.0 /100 | #184 | Fair 12.3% |
| Immigrants | Uzbekistan | 33.9 /100 | #185 | Fair 12.3% |
| Austrians | 33.3 /100 | #186 | Fair 12.3% |
| Serbians | 33.1 /100 | #187 | Fair 12.3% |
| Immigrants | North America | 32.8 /100 | #188 | Fair 12.3% |
| Immigrants | Albania | 31.6 /100 | #189 | Fair 12.3% |
| Immigrants | Honduras | 31.3 /100 | #190 | Fair 12.3% |
| Armenians | 29.7 /100 | #191 | Fair 12.3% |
Demographics Similar to Immigrants from France by Female Disability
In terms of female disability, the demographic groups most similar to Immigrants from France are Immigrants from Bulgaria (11.4%, a difference of 0.060%), Sri Lankan (11.4%, a difference of 0.10%), Immigrants from Spain (11.4%, a difference of 0.17%), Immigrants from Colombia (11.4%, a difference of 0.20%), and Immigrants from El Salvador (11.4%, a difference of 0.27%).
| Demographics | Rating | Rank | Female Disability |
| Peruvians | 99.9 /100 | #54 | Exceptional 11.3% |
| Bulgarians | 99.9 /100 | #55 | Exceptional 11.3% |
| Taiwanese | 99.9 /100 | #56 | Exceptional 11.4% |
| South Americans | 99.9 /100 | #57 | Exceptional 11.4% |
| Laotians | 99.9 /100 | #58 | Exceptional 11.4% |
| Immigrants | Spain | 99.9 /100 | #59 | Exceptional 11.4% |
| Immigrants | Bulgaria | 99.9 /100 | #60 | Exceptional 11.4% |
| Immigrants | France | 99.9 /100 | #61 | Exceptional 11.4% |
| Sri Lankans | 99.9 /100 | #62 | Exceptional 11.4% |
| Immigrants | Colombia | 99.9 /100 | #63 | Exceptional 11.4% |
| Immigrants | El Salvador | 99.9 /100 | #64 | Exceptional 11.4% |
| Immigrants | South America | 99.9 /100 | #65 | Exceptional 11.4% |
| Salvadorans | 99.8 /100 | #66 | Exceptional 11.5% |
| Immigrants | Vietnam | 99.8 /100 | #67 | Exceptional 11.5% |
| Immigrants | Northern Africa | 99.8 /100 | #68 | Exceptional 11.5% |