Egyptian vs Immigrants from France Female Disability
COMPARE
Egyptian
Immigrants from France
Female Disability
Female Disability Comparison
Egyptians
Immigrants from France
11.1%
FEMALE DISABILITY
100.0/ 100
METRIC RATING
28th/ 347
METRIC RANK
11.4%
FEMALE DISABILITY
99.9/ 100
METRIC RATING
61st/ 347
METRIC RANK
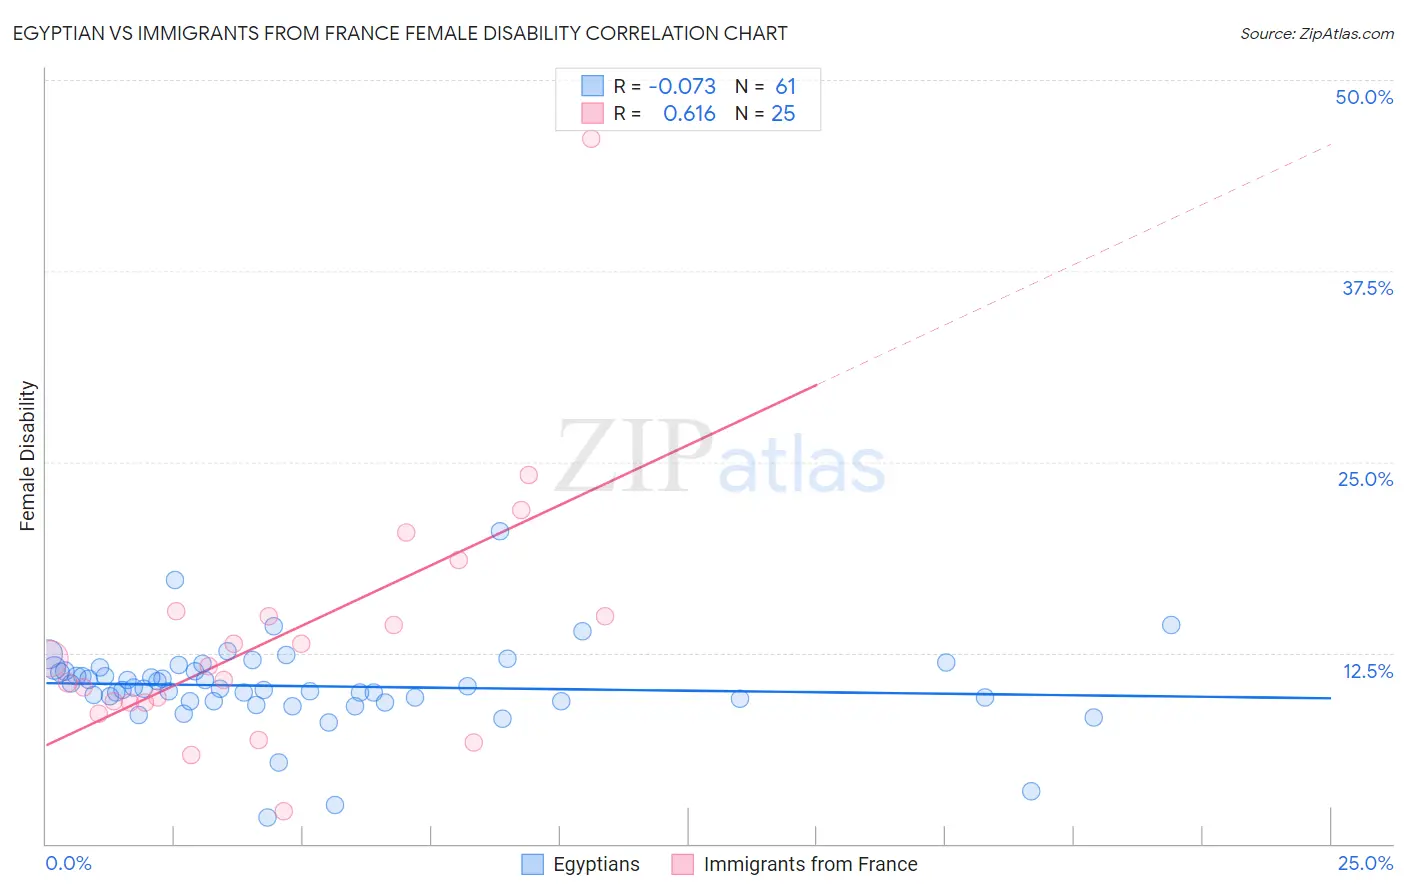
Egyptian vs Immigrants from France Female Disability Correlation Chart
The statistical analysis conducted on geographies consisting of 276,904,353 people shows a slight negative correlation between the proportion of Egyptians and percentage of females with a disability in the United States with a correlation coefficient (R) of -0.073 and weighted average of 11.1%. Similarly, the statistical analysis conducted on geographies consisting of 287,899,826 people shows a significant positive correlation between the proportion of Immigrants from France and percentage of females with a disability in the United States with a correlation coefficient (R) of 0.616 and weighted average of 11.4%, a difference of 2.8%.
Female Disability Correlation Summary
| Measurement | Egyptian | Immigrants from France |
| Minimum | 1.7% | 2.1% |
| Maximum | 20.5% | 46.2% |
| Range | 18.8% | 44.1% |
| Mean | 10.3% | 13.6% |
| Median | 10.2% | 11.7% |
| Interquartile 25% (IQ1) | 9.3% | 9.3% |
| Interquartile 75% (IQ3) | 11.4% | 15.0% |
| Interquartile Range (IQR) | 2.1% | 5.8% |
| Standard Deviation (Sample) | 2.8% | 8.5% |
| Standard Deviation (Population) | 2.8% | 8.3% |
Similar Demographics by Female Disability
Demographics Similar to Egyptians by Female Disability
In terms of female disability, the demographic groups most similar to Egyptians are Immigrants from Malaysia (11.1%, a difference of 0.060%), Turkish (11.1%, a difference of 0.070%), Immigrants from Kuwait (11.1%, a difference of 0.17%), Immigrants from Turkey (11.1%, a difference of 0.27%), and Immigrants from Australia (11.1%, a difference of 0.33%).
| Demographics | Rating | Rank | Female Disability |
| Asians | 100.0 /100 | #21 | Exceptional 10.9% |
| Immigrants | Sri Lanka | 100.0 /100 | #22 | Exceptional 10.9% |
| Venezuelans | 100.0 /100 | #23 | Exceptional 11.0% |
| Immigrants | Argentina | 100.0 /100 | #24 | Exceptional 11.0% |
| Immigrants | Asia | 100.0 /100 | #25 | Exceptional 11.0% |
| Argentineans | 100.0 /100 | #26 | Exceptional 11.0% |
| Immigrants | Turkey | 100.0 /100 | #27 | Exceptional 11.1% |
| Egyptians | 100.0 /100 | #28 | Exceptional 11.1% |
| Immigrants | Malaysia | 100.0 /100 | #29 | Exceptional 11.1% |
| Turks | 100.0 /100 | #30 | Exceptional 11.1% |
| Immigrants | Kuwait | 100.0 /100 | #31 | Exceptional 11.1% |
| Immigrants | Australia | 100.0 /100 | #32 | Exceptional 11.1% |
| Immigrants | Egypt | 100.0 /100 | #33 | Exceptional 11.1% |
| Immigrants | Indonesia | 100.0 /100 | #34 | Exceptional 11.2% |
| Immigrants | Japan | 100.0 /100 | #35 | Exceptional 11.2% |
Demographics Similar to Immigrants from France by Female Disability
In terms of female disability, the demographic groups most similar to Immigrants from France are Immigrants from Bulgaria (11.4%, a difference of 0.060%), Sri Lankan (11.4%, a difference of 0.10%), Immigrants from Spain (11.4%, a difference of 0.17%), Immigrants from Colombia (11.4%, a difference of 0.20%), and Immigrants from El Salvador (11.4%, a difference of 0.27%).
| Demographics | Rating | Rank | Female Disability |
| Peruvians | 99.9 /100 | #54 | Exceptional 11.3% |
| Bulgarians | 99.9 /100 | #55 | Exceptional 11.3% |
| Taiwanese | 99.9 /100 | #56 | Exceptional 11.4% |
| South Americans | 99.9 /100 | #57 | Exceptional 11.4% |
| Laotians | 99.9 /100 | #58 | Exceptional 11.4% |
| Immigrants | Spain | 99.9 /100 | #59 | Exceptional 11.4% |
| Immigrants | Bulgaria | 99.9 /100 | #60 | Exceptional 11.4% |
| Immigrants | France | 99.9 /100 | #61 | Exceptional 11.4% |
| Sri Lankans | 99.9 /100 | #62 | Exceptional 11.4% |
| Immigrants | Colombia | 99.9 /100 | #63 | Exceptional 11.4% |
| Immigrants | El Salvador | 99.9 /100 | #64 | Exceptional 11.4% |
| Immigrants | South America | 99.9 /100 | #65 | Exceptional 11.4% |
| Salvadorans | 99.8 /100 | #66 | Exceptional 11.5% |
| Immigrants | Vietnam | 99.8 /100 | #67 | Exceptional 11.5% |
| Immigrants | Northern Africa | 99.8 /100 | #68 | Exceptional 11.5% |