Iraqi vs Immigrants from Sri Lanka Female Disability
COMPARE
Iraqi
Immigrants from Sri Lanka
Female Disability
Female Disability Comparison
Iraqis
Immigrants from Sri Lanka
12.3%
FEMALE DISABILITY
36.0/ 100
METRIC RATING
184th/ 347
METRIC RANK
10.9%
FEMALE DISABILITY
100.0/ 100
METRIC RATING
22nd/ 347
METRIC RANK
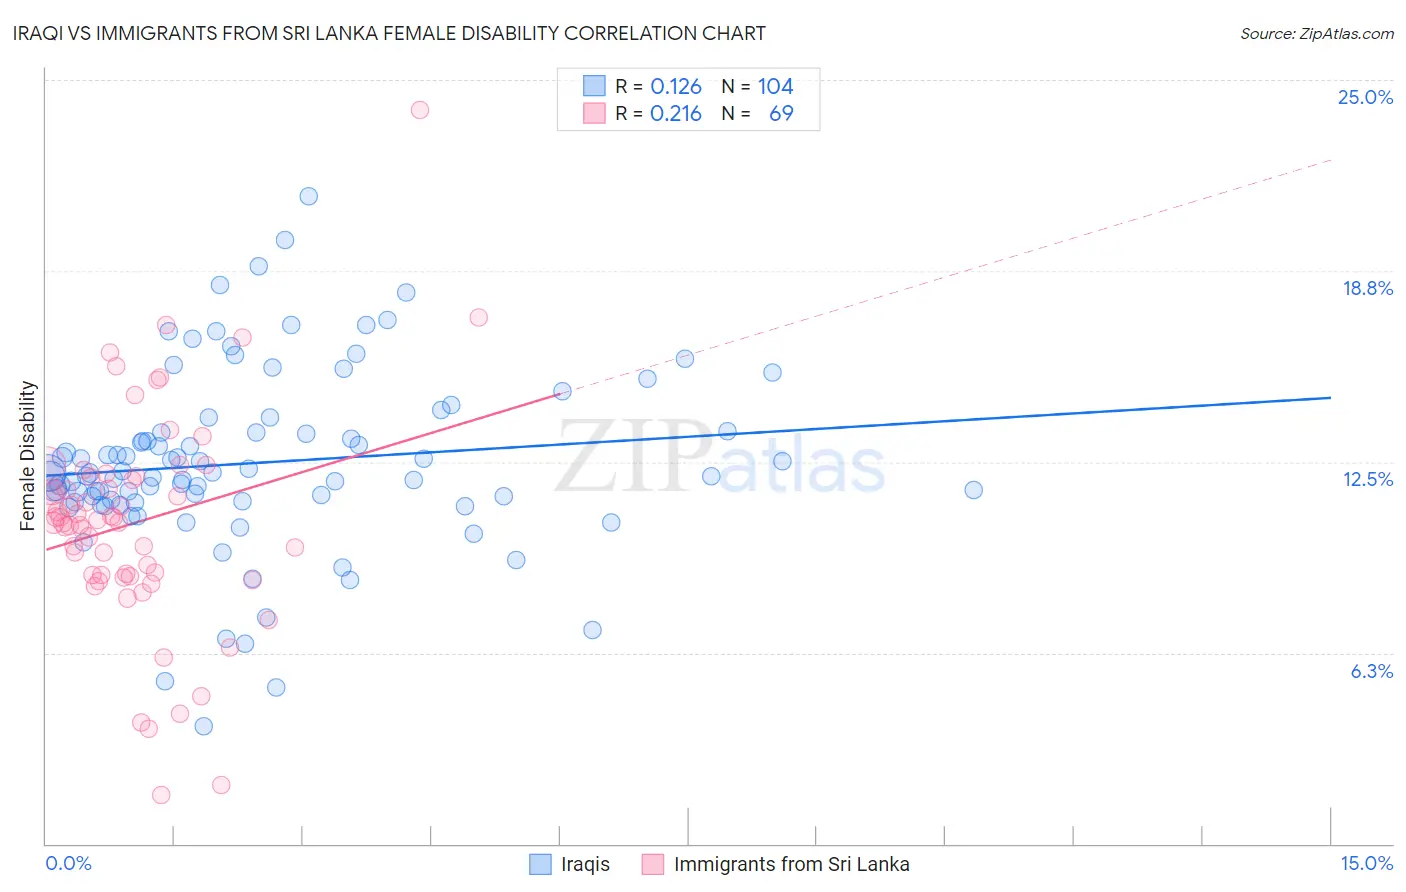
Iraqi vs Immigrants from Sri Lanka Female Disability Correlation Chart
The statistical analysis conducted on geographies consisting of 170,640,782 people shows a poor positive correlation between the proportion of Iraqis and percentage of females with a disability in the United States with a correlation coefficient (R) of 0.126 and weighted average of 12.3%. Similarly, the statistical analysis conducted on geographies consisting of 149,700,552 people shows a weak positive correlation between the proportion of Immigrants from Sri Lanka and percentage of females with a disability in the United States with a correlation coefficient (R) of 0.216 and weighted average of 10.9%, a difference of 12.2%.
Female Disability Correlation Summary
| Measurement | Iraqi | Immigrants from Sri Lanka |
| Minimum | 3.8% | 1.6% |
| Maximum | 21.2% | 24.0% |
| Range | 17.3% | 22.4% |
| Mean | 12.5% | 10.5% |
| Median | 12.1% | 10.5% |
| Interquartile 25% (IQ1) | 11.2% | 8.8% |
| Interquartile 75% (IQ3) | 13.5% | 12.0% |
| Interquartile Range (IQR) | 2.3% | 3.2% |
| Standard Deviation (Sample) | 3.0% | 3.6% |
| Standard Deviation (Population) | 2.9% | 3.6% |
Similar Demographics by Female Disability
Demographics Similar to Iraqis by Female Disability
In terms of female disability, the demographic groups most similar to Iraqis are Cuban (12.3%, a difference of 0.020%), Norwegian (12.3%, a difference of 0.040%), Immigrants from Canada (12.3%, a difference of 0.050%), Albanian (12.3%, a difference of 0.080%), and Immigrants from Uzbekistan (12.3%, a difference of 0.080%).
| Demographics | Rating | Rank | Female Disability |
| Immigrants | Ghana | 42.5 /100 | #177 | Average 12.2% |
| Immigrants | Western Europe | 40.9 /100 | #178 | Average 12.2% |
| Immigrants | Fiji | 38.2 /100 | #179 | Fair 12.3% |
| Albanians | 37.9 /100 | #180 | Fair 12.3% |
| Immigrants | Canada | 37.2 /100 | #181 | Fair 12.3% |
| Norwegians | 36.9 /100 | #182 | Fair 12.3% |
| Cubans | 36.5 /100 | #183 | Fair 12.3% |
| Iraqis | 36.0 /100 | #184 | Fair 12.3% |
| Immigrants | Uzbekistan | 33.9 /100 | #185 | Fair 12.3% |
| Austrians | 33.3 /100 | #186 | Fair 12.3% |
| Serbians | 33.1 /100 | #187 | Fair 12.3% |
| Immigrants | North America | 32.8 /100 | #188 | Fair 12.3% |
| Immigrants | Albania | 31.6 /100 | #189 | Fair 12.3% |
| Immigrants | Honduras | 31.3 /100 | #190 | Fair 12.3% |
| Armenians | 29.7 /100 | #191 | Fair 12.3% |
Demographics Similar to Immigrants from Sri Lanka by Female Disability
In terms of female disability, the demographic groups most similar to Immigrants from Sri Lanka are Asian (10.9%, a difference of 0.13%), Venezuelan (11.0%, a difference of 0.22%), Immigrants from Pakistan (10.9%, a difference of 0.49%), Immigrants from Venezuela (10.9%, a difference of 0.66%), and Immigrants from Argentina (11.0%, a difference of 0.79%).
| Demographics | Rating | Rank | Female Disability |
| Burmese | 100.0 /100 | #15 | Exceptional 10.7% |
| Okinawans | 100.0 /100 | #16 | Exceptional 10.8% |
| Indians (Asian) | 100.0 /100 | #17 | Exceptional 10.8% |
| Immigrants | Iran | 100.0 /100 | #18 | Exceptional 10.8% |
| Immigrants | Venezuela | 100.0 /100 | #19 | Exceptional 10.9% |
| Immigrants | Pakistan | 100.0 /100 | #20 | Exceptional 10.9% |
| Asians | 100.0 /100 | #21 | Exceptional 10.9% |
| Immigrants | Sri Lanka | 100.0 /100 | #22 | Exceptional 10.9% |
| Venezuelans | 100.0 /100 | #23 | Exceptional 11.0% |
| Immigrants | Argentina | 100.0 /100 | #24 | Exceptional 11.0% |
| Immigrants | Asia | 100.0 /100 | #25 | Exceptional 11.0% |
| Argentineans | 100.0 /100 | #26 | Exceptional 11.0% |
| Immigrants | Turkey | 100.0 /100 | #27 | Exceptional 11.1% |
| Egyptians | 100.0 /100 | #28 | Exceptional 11.1% |
| Immigrants | Malaysia | 100.0 /100 | #29 | Exceptional 11.1% |