Immigrants from South America vs Immigrants from France Female Disability
COMPARE
Immigrants from South America
Immigrants from France
Female Disability
Female Disability Comparison
Immigrants from South America
Immigrants from France
11.4%
FEMALE DISABILITY
99.9/ 100
METRIC RATING
65th/ 347
METRIC RANK
11.4%
FEMALE DISABILITY
99.9/ 100
METRIC RATING
61st/ 347
METRIC RANK
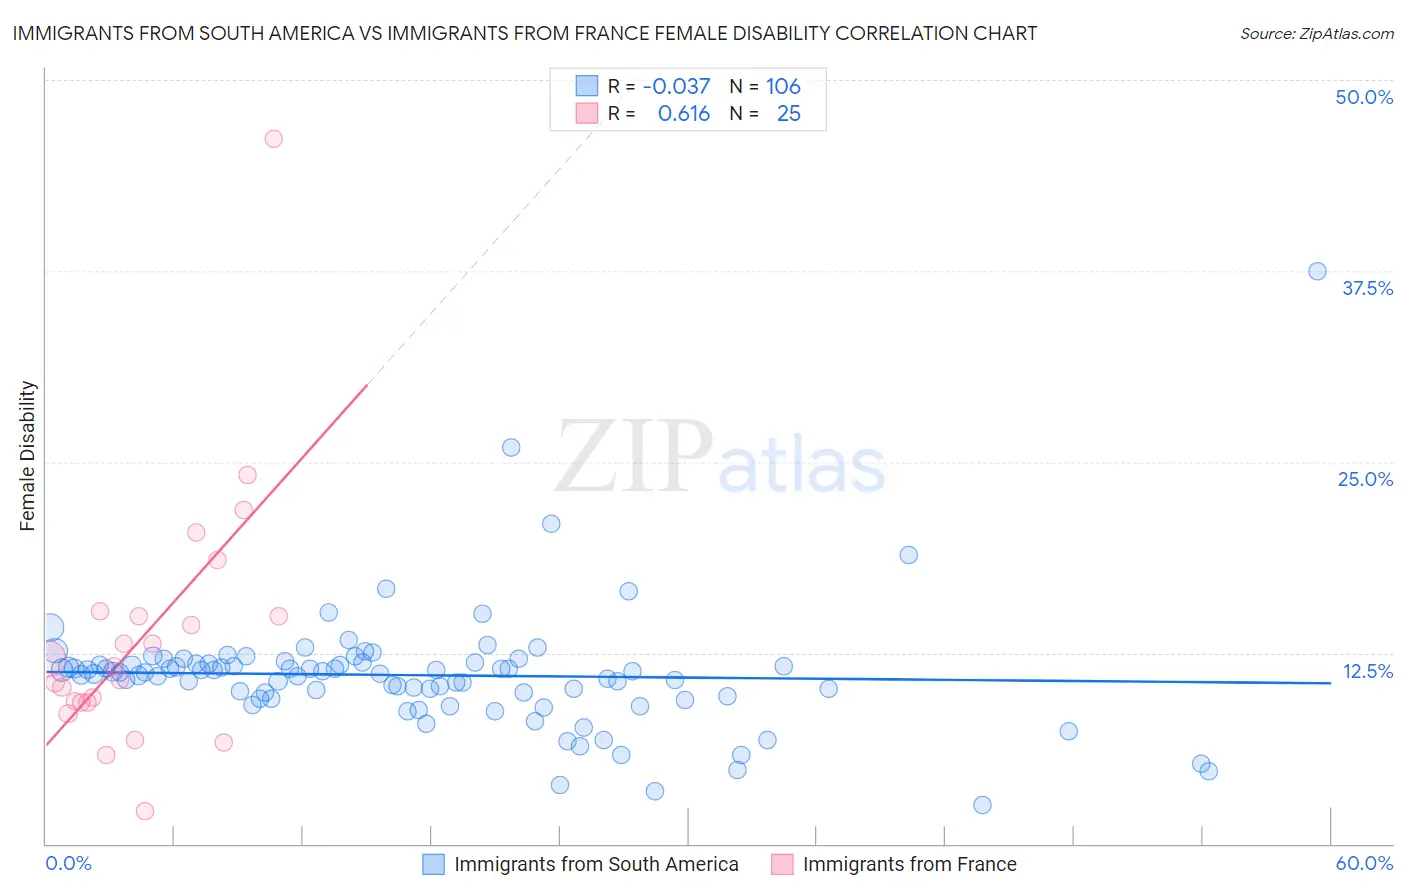
Immigrants from South America vs Immigrants from France Female Disability Correlation Chart
The statistical analysis conducted on geographies consisting of 486,308,642 people shows no correlation between the proportion of Immigrants from South America and percentage of females with a disability in the United States with a correlation coefficient (R) of -0.037 and weighted average of 11.4%. Similarly, the statistical analysis conducted on geographies consisting of 287,899,826 people shows a significant positive correlation between the proportion of Immigrants from France and percentage of females with a disability in the United States with a correlation coefficient (R) of 0.616 and weighted average of 11.4%, a difference of 0.29%.
Female Disability Correlation Summary
| Measurement | Immigrants from South America | Immigrants from France |
| Minimum | 2.5% | 2.1% |
| Maximum | 37.5% | 46.2% |
| Range | 35.0% | 44.1% |
| Mean | 11.0% | 13.6% |
| Median | 11.2% | 11.7% |
| Interquartile 25% (IQ1) | 9.6% | 9.3% |
| Interquartile 75% (IQ3) | 11.8% | 15.0% |
| Interquartile Range (IQR) | 2.2% | 5.8% |
| Standard Deviation (Sample) | 4.1% | 8.5% |
| Standard Deviation (Population) | 4.1% | 8.3% |
Demographics Similar to Immigrants from South America and Immigrants from France by Female Disability
In terms of female disability, the demographic groups most similar to Immigrants from South America are Immigrants from El Salvador (11.4%, a difference of 0.020%), Immigrants from Colombia (11.4%, a difference of 0.090%), Salvadoran (11.5%, a difference of 0.17%), Sri Lankan (11.4%, a difference of 0.19%), and Immigrants from Vietnam (11.5%, a difference of 0.22%). Similarly, the demographic groups most similar to Immigrants from France are Immigrants from Bulgaria (11.4%, a difference of 0.060%), Sri Lankan (11.4%, a difference of 0.10%), Immigrants from Spain (11.4%, a difference of 0.17%), Immigrants from Colombia (11.4%, a difference of 0.20%), and Immigrants from El Salvador (11.4%, a difference of 0.27%).
| Demographics | Rating | Rank | Female Disability |
| Immigrants | Saudi Arabia | 99.9 /100 | #53 | Exceptional 11.3% |
| Peruvians | 99.9 /100 | #54 | Exceptional 11.3% |
| Bulgarians | 99.9 /100 | #55 | Exceptional 11.3% |
| Taiwanese | 99.9 /100 | #56 | Exceptional 11.4% |
| South Americans | 99.9 /100 | #57 | Exceptional 11.4% |
| Laotians | 99.9 /100 | #58 | Exceptional 11.4% |
| Immigrants | Spain | 99.9 /100 | #59 | Exceptional 11.4% |
| Immigrants | Bulgaria | 99.9 /100 | #60 | Exceptional 11.4% |
| Immigrants | France | 99.9 /100 | #61 | Exceptional 11.4% |
| Sri Lankans | 99.9 /100 | #62 | Exceptional 11.4% |
| Immigrants | Colombia | 99.9 /100 | #63 | Exceptional 11.4% |
| Immigrants | El Salvador | 99.9 /100 | #64 | Exceptional 11.4% |
| Immigrants | South America | 99.9 /100 | #65 | Exceptional 11.4% |
| Salvadorans | 99.8 /100 | #66 | Exceptional 11.5% |
| Immigrants | Vietnam | 99.8 /100 | #67 | Exceptional 11.5% |
| Immigrants | Northern Africa | 99.8 /100 | #68 | Exceptional 11.5% |
| Colombians | 99.8 /100 | #69 | Exceptional 11.5% |
| Immigrants | Chile | 99.8 /100 | #70 | Exceptional 11.5% |
| Immigrants | Ireland | 99.8 /100 | #71 | Exceptional 11.5% |
| Chileans | 99.8 /100 | #72 | Exceptional 11.5% |
| Immigrants | Switzerland | 99.8 /100 | #73 | Exceptional 11.5% |