Immigrants from Cabo Verde vs Venezuelan Ambulatory Disability
COMPARE
Immigrants from Cabo Verde
Venezuelan
Ambulatory Disability
Ambulatory Disability Comparison
Immigrants from Cabo Verde
Venezuelans
7.0%
AMBULATORY DISABILITY
0.0/ 100
METRIC RATING
304th/ 347
METRIC RANK
5.5%
AMBULATORY DISABILITY
99.9/ 100
METRIC RATING
40th/ 347
METRIC RANK
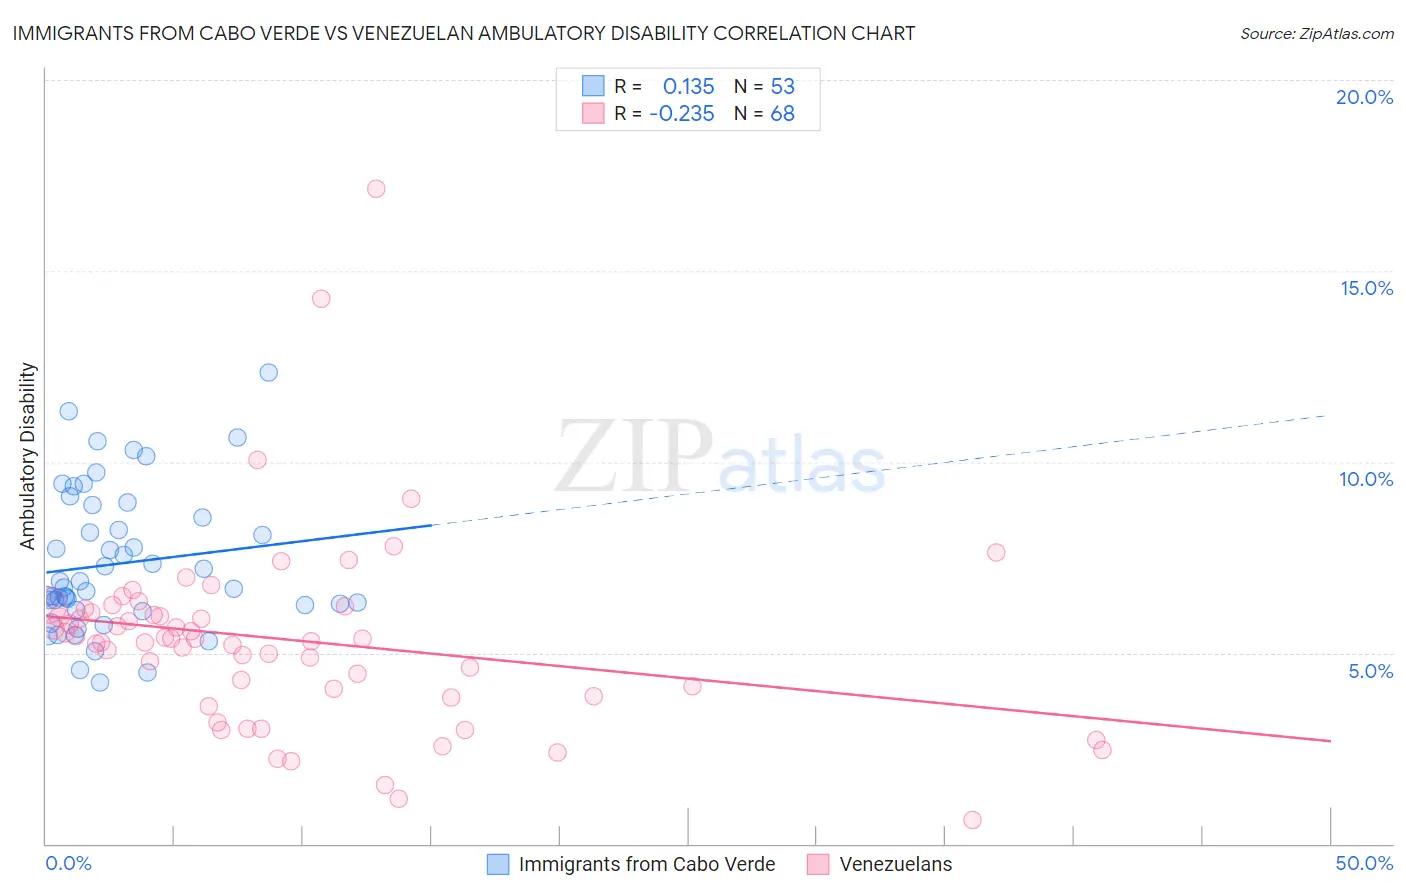
Immigrants from Cabo Verde vs Venezuelan Ambulatory Disability Correlation Chart
The statistical analysis conducted on geographies consisting of 38,149,836 people shows a poor positive correlation between the proportion of Immigrants from Cabo Verde and percentage of population with ambulatory disability in the United States with a correlation coefficient (R) of 0.135 and weighted average of 7.0%. Similarly, the statistical analysis conducted on geographies consisting of 306,237,534 people shows a weak negative correlation between the proportion of Venezuelans and percentage of population with ambulatory disability in the United States with a correlation coefficient (R) of -0.235 and weighted average of 5.5%, a difference of 27.1%.
Ambulatory Disability Correlation Summary
| Measurement | Immigrants from Cabo Verde | Venezuelan |
| Minimum | 4.2% | 0.63% |
| Maximum | 12.3% | 17.1% |
| Range | 8.1% | 16.5% |
| Mean | 7.3% | 5.3% |
| Median | 6.7% | 5.4% |
| Interquartile 25% (IQ1) | 6.2% | 4.0% |
| Interquartile 75% (IQ3) | 8.7% | 6.1% |
| Interquartile Range (IQR) | 2.5% | 2.1% |
| Standard Deviation (Sample) | 1.8% | 2.6% |
| Standard Deviation (Population) | 1.8% | 2.5% |
Similar Demographics by Ambulatory Disability
Demographics Similar to Immigrants from Cabo Verde by Ambulatory Disability
In terms of ambulatory disability, the demographic groups most similar to Immigrants from Cabo Verde are Immigrants from Micronesia (7.0%, a difference of 0.29%), African (7.0%, a difference of 0.36%), Immigrants from Armenia (7.0%, a difference of 0.42%), British West Indian (7.0%, a difference of 0.47%), and Marshallese (6.9%, a difference of 0.70%).
| Demographics | Rating | Rank | Ambulatory Disability |
| French American Indians | 0.0 /100 | #297 | Tragic 6.9% |
| Immigrants | Grenada | 0.0 /100 | #298 | Tragic 6.9% |
| Puget Sound Salish | 0.0 /100 | #299 | Tragic 6.9% |
| Marshallese | 0.0 /100 | #300 | Tragic 6.9% |
| British West Indians | 0.0 /100 | #301 | Tragic 7.0% |
| Immigrants | Armenia | 0.0 /100 | #302 | Tragic 7.0% |
| Africans | 0.0 /100 | #303 | Tragic 7.0% |
| Immigrants | Cabo Verde | 0.0 /100 | #304 | Tragic 7.0% |
| Immigrants | Micronesia | 0.0 /100 | #305 | Tragic 7.0% |
| Iroquois | 0.0 /100 | #306 | Tragic 7.1% |
| Spanish Americans | 0.0 /100 | #307 | Tragic 7.1% |
| Chippewa | 0.0 /100 | #308 | Tragic 7.1% |
| Immigrants | Azores | 0.0 /100 | #309 | Tragic 7.1% |
| Arapaho | 0.0 /100 | #310 | Tragic 7.1% |
| Cree | 0.0 /100 | #311 | Tragic 7.1% |
Demographics Similar to Venezuelans by Ambulatory Disability
In terms of ambulatory disability, the demographic groups most similar to Venezuelans are Mongolian (5.5%, a difference of 0.080%), Argentinean (5.5%, a difference of 0.16%), Immigrants from Eritrea (5.5%, a difference of 0.34%), Turkish (5.5%, a difference of 0.43%), and Cypriot (5.5%, a difference of 0.43%).
| Demographics | Rating | Rank | Ambulatory Disability |
| Immigrants | Pakistan | 100.0 /100 | #33 | Exceptional 5.5% |
| Immigrants | Asia | 100.0 /100 | #34 | Exceptional 5.5% |
| Afghans | 100.0 /100 | #35 | Exceptional 5.5% |
| Immigrants | Malaysia | 100.0 /100 | #36 | Exceptional 5.5% |
| Turks | 100.0 /100 | #37 | Exceptional 5.5% |
| Cypriots | 100.0 /100 | #38 | Exceptional 5.5% |
| Immigrants | Eritrea | 100.0 /100 | #39 | Exceptional 5.5% |
| Venezuelans | 99.9 /100 | #40 | Exceptional 5.5% |
| Mongolians | 99.9 /100 | #41 | Exceptional 5.5% |
| Argentineans | 99.9 /100 | #42 | Exceptional 5.5% |
| Paraguayans | 99.9 /100 | #43 | Exceptional 5.5% |
| Immigrants | Indonesia | 99.9 /100 | #44 | Exceptional 5.5% |
| Immigrants | Sweden | 99.9 /100 | #45 | Exceptional 5.6% |
| Egyptians | 99.9 /100 | #46 | Exceptional 5.6% |
| Immigrants | Japan | 99.9 /100 | #47 | Exceptional 5.6% |