U.S. Virgin Islander vs Irish Male Disability
COMPARE
U.S. Virgin Islander
Irish
Male Disability
Male Disability Comparison
U.S. Virgin Islanders
Irish
11.9%
MALE DISABILITY
1.3/ 100
METRIC RATING
236th/ 347
METRIC RANK
12.7%
MALE DISABILITY
0.0/ 100
METRIC RATING
282nd/ 347
METRIC RANK
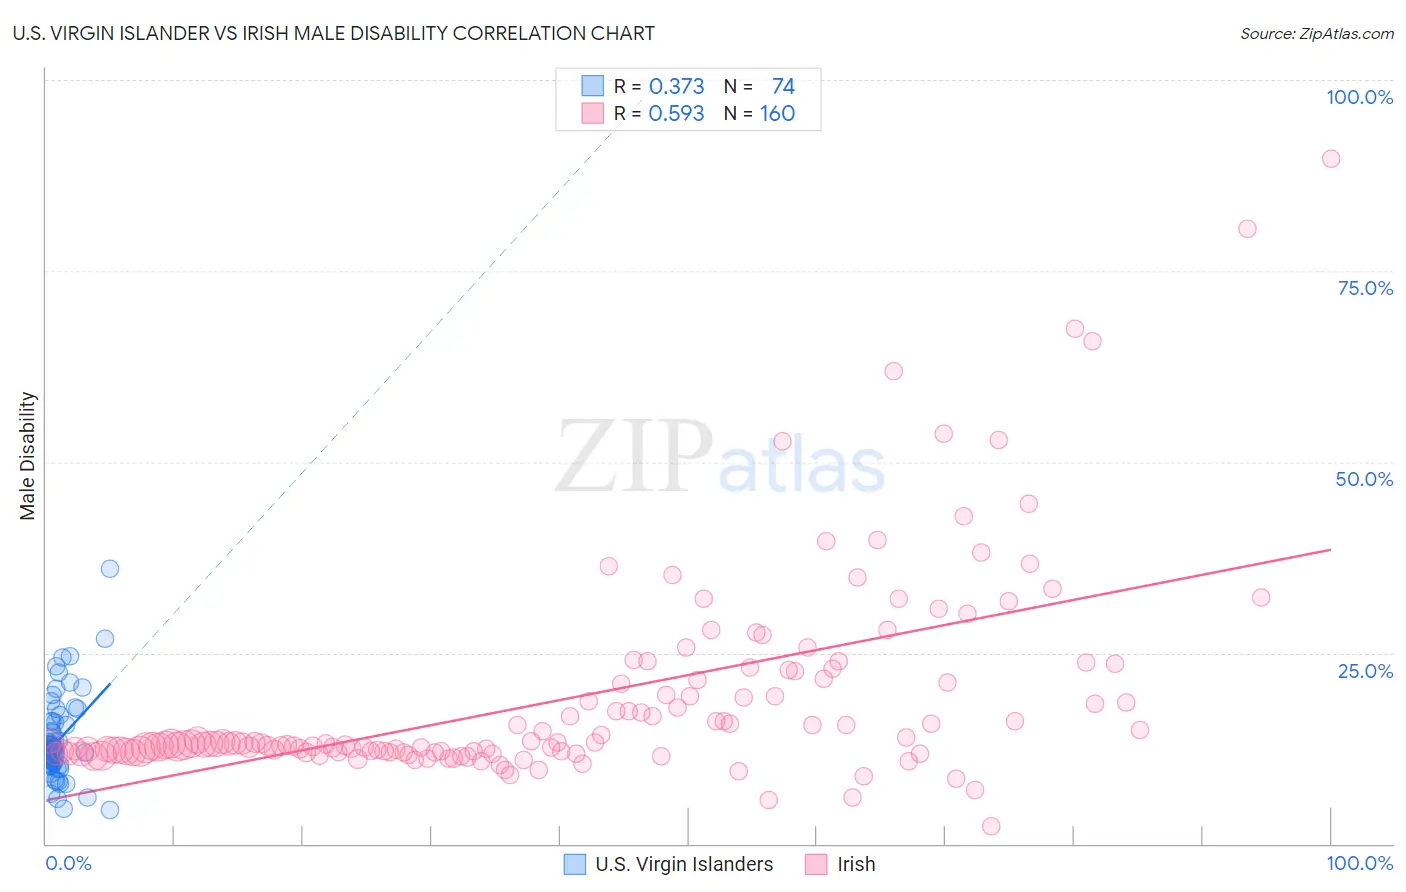
U.S. Virgin Islander vs Irish Male Disability Correlation Chart
The statistical analysis conducted on geographies consisting of 87,521,484 people shows a mild positive correlation between the proportion of U.S. Virgin Islanders and percentage of males with a disability in the United States with a correlation coefficient (R) of 0.373 and weighted average of 11.9%. Similarly, the statistical analysis conducted on geographies consisting of 580,201,634 people shows a substantial positive correlation between the proportion of Irish and percentage of males with a disability in the United States with a correlation coefficient (R) of 0.593 and weighted average of 12.7%, a difference of 7.0%.
Male Disability Correlation Summary
| Measurement | U.S. Virgin Islander | Irish |
| Minimum | 4.4% | 2.4% |
| Maximum | 36.0% | 89.8% |
| Range | 31.6% | 87.4% |
| Mean | 13.4% | 19.1% |
| Median | 12.1% | 13.1% |
| Interquartile 25% (IQ1) | 10.6% | 12.0% |
| Interquartile 75% (IQ3) | 15.5% | 21.6% |
| Interquartile Range (IQR) | 4.9% | 9.5% |
| Standard Deviation (Sample) | 5.3% | 13.6% |
| Standard Deviation (Population) | 5.3% | 13.5% |
Similar Demographics by Male Disability
Demographics Similar to U.S. Virgin Islanders by Male Disability
In terms of male disability, the demographic groups most similar to U.S. Virgin Islanders are Carpatho Rusyn (11.9%, a difference of 0.010%), Yugoslavian (11.9%, a difference of 0.11%), Immigrants from North America (11.9%, a difference of 0.14%), Italian (11.9%, a difference of 0.16%), and Czech (11.9%, a difference of 0.21%).
| Demographics | Rating | Rank | Male Disability |
| Bermudans | 2.3 /100 | #229 | Tragic 11.8% |
| Croatians | 2.1 /100 | #230 | Tragic 11.8% |
| Dominicans | 1.8 /100 | #231 | Tragic 11.8% |
| Malaysians | 1.8 /100 | #232 | Tragic 11.8% |
| Mexicans | 1.7 /100 | #233 | Tragic 11.8% |
| Immigrants | Canada | 1.6 /100 | #234 | Tragic 11.9% |
| Immigrants | North America | 1.5 /100 | #235 | Tragic 11.9% |
| U.S. Virgin Islanders | 1.3 /100 | #236 | Tragic 11.9% |
| Carpatho Rusyns | 1.3 /100 | #237 | Tragic 11.9% |
| Yugoslavians | 1.2 /100 | #238 | Tragic 11.9% |
| Italians | 1.2 /100 | #239 | Tragic 11.9% |
| Czechs | 1.1 /100 | #240 | Tragic 11.9% |
| Bahamians | 1.1 /100 | #241 | Tragic 11.9% |
| Northern Europeans | 1.1 /100 | #242 | Tragic 11.9% |
| Samoans | 1.1 /100 | #243 | Tragic 11.9% |
Demographics Similar to Irish by Male Disability
In terms of male disability, the demographic groups most similar to Irish are German (12.7%, a difference of 0.010%), Sioux (12.7%, a difference of 0.060%), Dutch (12.7%, a difference of 0.11%), Slovak (12.7%, a difference of 0.16%), and Spanish (12.7%, a difference of 0.28%).
| Demographics | Rating | Rank | Male Disability |
| Fijians | 0.0 /100 | #275 | Tragic 12.6% |
| Africans | 0.0 /100 | #276 | Tragic 12.6% |
| Finns | 0.0 /100 | #277 | Tragic 12.6% |
| Central American Indians | 0.0 /100 | #278 | Tragic 12.7% |
| Slovaks | 0.0 /100 | #279 | Tragic 12.7% |
| Dutch | 0.0 /100 | #280 | Tragic 12.7% |
| Sioux | 0.0 /100 | #281 | Tragic 12.7% |
| Irish | 0.0 /100 | #282 | Tragic 12.7% |
| Germans | 0.0 /100 | #283 | Tragic 12.7% |
| Spanish | 0.0 /100 | #284 | Tragic 12.7% |
| Welsh | 0.0 /100 | #285 | Tragic 12.7% |
| Scottish | 0.0 /100 | #286 | Tragic 12.8% |
| Cape Verdeans | 0.0 /100 | #287 | Tragic 12.8% |
| Yup'ik | 0.0 /100 | #288 | Tragic 12.8% |
| Immigrants | Cabo Verde | 0.0 /100 | #289 | Tragic 12.8% |