Immigrants from Hong Kong vs Irish Male Disability
COMPARE
Immigrants from Hong Kong
Irish
Male Disability
Male Disability Comparison
Immigrants from Hong Kong
Irish
9.4%
MALE DISABILITY
100.0/ 100
METRIC RATING
5th/ 347
METRIC RANK
12.7%
MALE DISABILITY
0.0/ 100
METRIC RATING
282nd/ 347
METRIC RANK
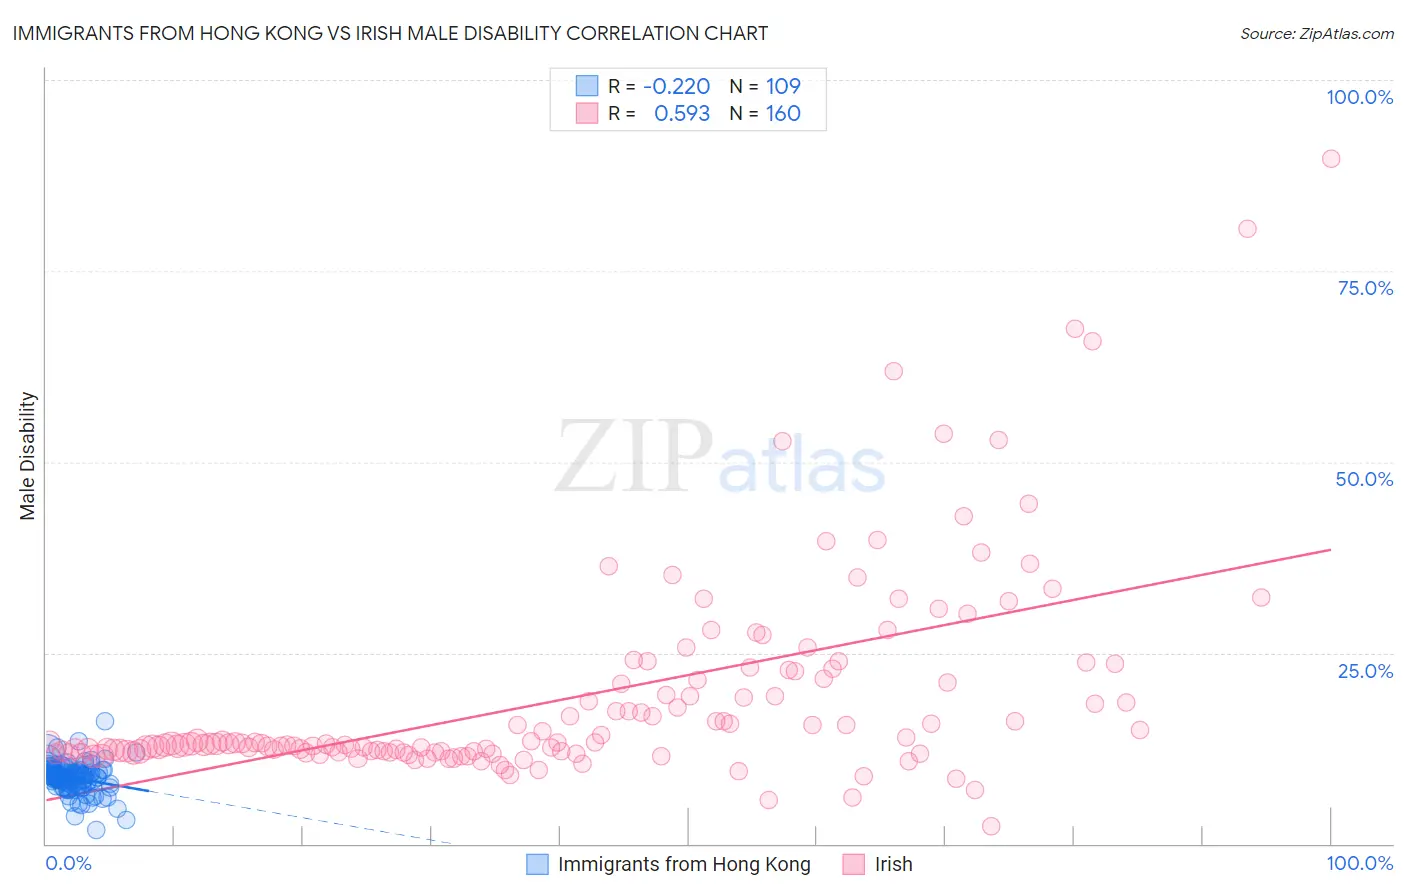
Immigrants from Hong Kong vs Irish Male Disability Correlation Chart
The statistical analysis conducted on geographies consisting of 253,984,960 people shows a weak negative correlation between the proportion of Immigrants from Hong Kong and percentage of males with a disability in the United States with a correlation coefficient (R) of -0.220 and weighted average of 9.4%. Similarly, the statistical analysis conducted on geographies consisting of 580,201,634 people shows a substantial positive correlation between the proportion of Irish and percentage of males with a disability in the United States with a correlation coefficient (R) of 0.593 and weighted average of 12.7%, a difference of 34.9%.
Male Disability Correlation Summary
| Measurement | Immigrants from Hong Kong | Irish |
| Minimum | 1.8% | 2.4% |
| Maximum | 16.1% | 89.8% |
| Range | 14.3% | 87.4% |
| Mean | 8.6% | 19.1% |
| Median | 8.7% | 13.1% |
| Interquartile 25% (IQ1) | 7.8% | 12.0% |
| Interquartile 75% (IQ3) | 9.6% | 21.6% |
| Interquartile Range (IQR) | 1.9% | 9.5% |
| Standard Deviation (Sample) | 2.0% | 13.6% |
| Standard Deviation (Population) | 1.9% | 13.5% |
Similar Demographics by Male Disability
Demographics Similar to Immigrants from Hong Kong by Male Disability
In terms of male disability, the demographic groups most similar to Immigrants from Hong Kong are Immigrants from South Central Asia (9.4%, a difference of 0.060%), Immigrants from Bolivia (9.5%, a difference of 0.39%), Immigrants from China (9.5%, a difference of 0.99%), Immigrants from Singapore (9.5%, a difference of 1.1%), and Immigrants from Israel (9.6%, a difference of 1.5%).
| Demographics | Rating | Rank | Male Disability |
| Immigrants | India | 100.0 /100 | #1 | Exceptional 9.0% |
| Immigrants | Taiwan | 100.0 /100 | #2 | Exceptional 9.1% |
| Filipinos | 100.0 /100 | #3 | Exceptional 9.1% |
| Thais | 100.0 /100 | #4 | Exceptional 9.2% |
| Immigrants | Hong Kong | 100.0 /100 | #5 | Exceptional 9.4% |
| Immigrants | South Central Asia | 100.0 /100 | #6 | Exceptional 9.4% |
| Immigrants | Bolivia | 100.0 /100 | #7 | Exceptional 9.5% |
| Immigrants | China | 100.0 /100 | #8 | Exceptional 9.5% |
| Immigrants | Singapore | 100.0 /100 | #9 | Exceptional 9.5% |
| Immigrants | Israel | 100.0 /100 | #10 | Exceptional 9.6% |
| Immigrants | Eastern Asia | 100.0 /100 | #11 | Exceptional 9.6% |
| Bolivians | 100.0 /100 | #12 | Exceptional 9.6% |
| Iranians | 100.0 /100 | #13 | Exceptional 9.7% |
| Immigrants | Iran | 100.0 /100 | #14 | Exceptional 9.7% |
| Indians (Asian) | 100.0 /100 | #15 | Exceptional 9.7% |
Demographics Similar to Irish by Male Disability
In terms of male disability, the demographic groups most similar to Irish are German (12.7%, a difference of 0.010%), Sioux (12.7%, a difference of 0.060%), Dutch (12.7%, a difference of 0.11%), Slovak (12.7%, a difference of 0.16%), and Spanish (12.7%, a difference of 0.28%).
| Demographics | Rating | Rank | Male Disability |
| Fijians | 0.0 /100 | #275 | Tragic 12.6% |
| Africans | 0.0 /100 | #276 | Tragic 12.6% |
| Finns | 0.0 /100 | #277 | Tragic 12.6% |
| Central American Indians | 0.0 /100 | #278 | Tragic 12.7% |
| Slovaks | 0.0 /100 | #279 | Tragic 12.7% |
| Dutch | 0.0 /100 | #280 | Tragic 12.7% |
| Sioux | 0.0 /100 | #281 | Tragic 12.7% |
| Irish | 0.0 /100 | #282 | Tragic 12.7% |
| Germans | 0.0 /100 | #283 | Tragic 12.7% |
| Spanish | 0.0 /100 | #284 | Tragic 12.7% |
| Welsh | 0.0 /100 | #285 | Tragic 12.7% |
| Scottish | 0.0 /100 | #286 | Tragic 12.8% |
| Cape Verdeans | 0.0 /100 | #287 | Tragic 12.8% |
| Yup'ik | 0.0 /100 | #288 | Tragic 12.8% |
| Immigrants | Cabo Verde | 0.0 /100 | #289 | Tragic 12.8% |