Indonesian vs Irish Unemployment Among Ages 30 to 34 years
COMPARE
Indonesian
Irish
Unemployment Among Ages 30 to 34 years
Unemployment Among Ages 30 to 34 years Comparison
Indonesians
Irish
5.2%
UNEMPLOYMENT AMONG AGES 30 TO 34 YEARS
95.1/ 100
METRIC RATING
78th/ 347
METRIC RANK
5.5%
UNEMPLOYMENT AMONG AGES 30 TO 34 YEARS
31.3/ 100
METRIC RATING
191st/ 347
METRIC RANK
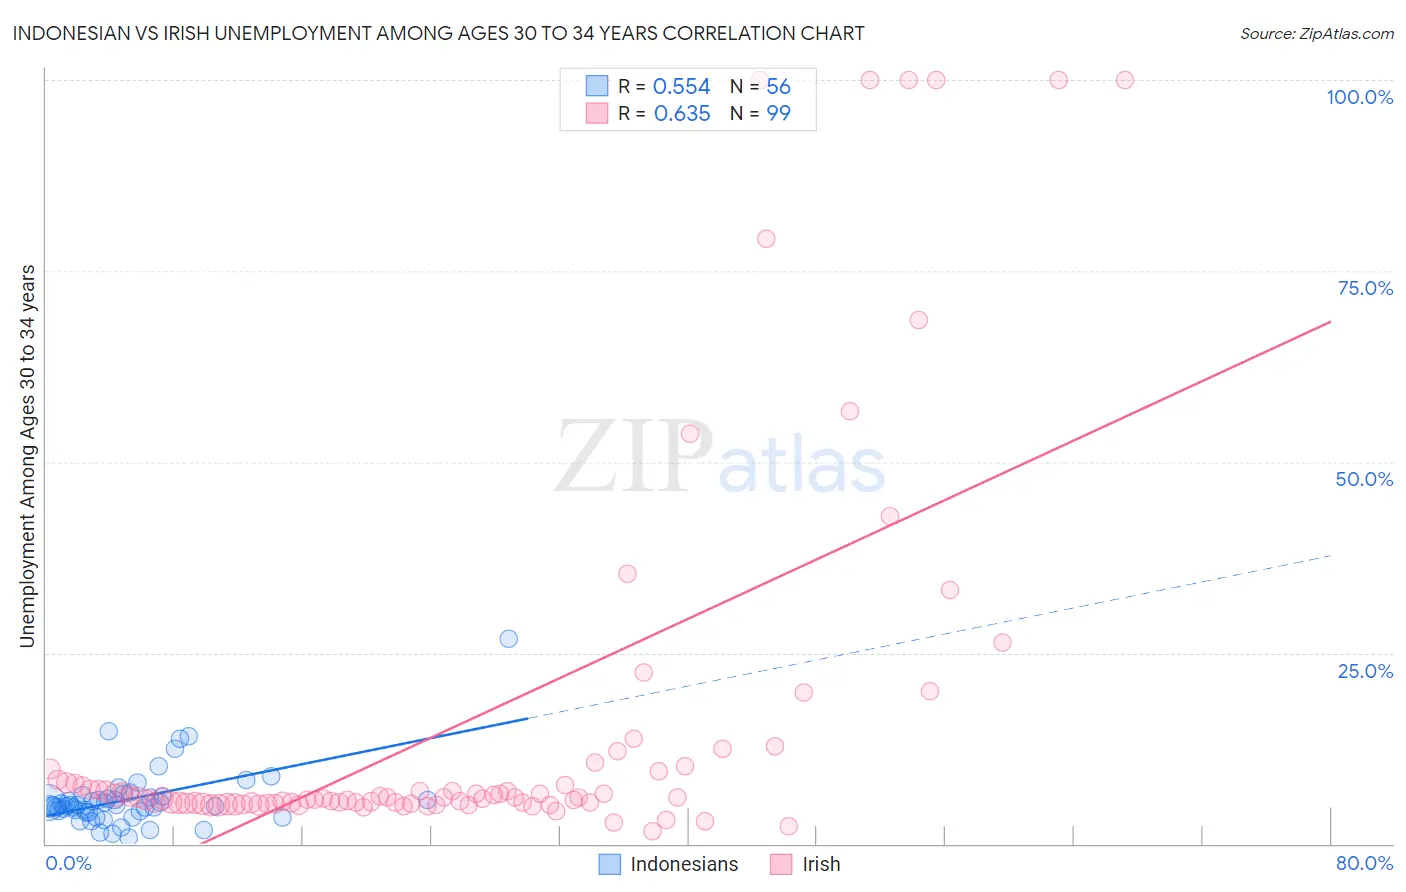
Indonesian vs Irish Unemployment Among Ages 30 to 34 years Correlation Chart
The statistical analysis conducted on geographies consisting of 159,189,213 people shows a substantial positive correlation between the proportion of Indonesians and unemployment rate among population between the ages 30 and 34 in the United States with a correlation coefficient (R) of 0.554 and weighted average of 5.2%. Similarly, the statistical analysis conducted on geographies consisting of 502,163,490 people shows a significant positive correlation between the proportion of Irish and unemployment rate among population between the ages 30 and 34 in the United States with a correlation coefficient (R) of 0.635 and weighted average of 5.5%, a difference of 6.9%.
Unemployment Among Ages 30 to 34 years Correlation Summary
| Measurement | Indonesian | Irish |
| Minimum | 0.80% | 1.7% |
| Maximum | 26.8% | 100.0% |
| Range | 26.0% | 98.3% |
| Mean | 5.9% | 15.8% |
| Median | 5.0% | 6.0% |
| Interquartile 25% (IQ1) | 4.2% | 5.3% |
| Interquartile 75% (IQ3) | 6.2% | 9.5% |
| Interquartile Range (IQR) | 2.0% | 4.2% |
| Standard Deviation (Sample) | 4.1% | 25.1% |
| Standard Deviation (Population) | 4.0% | 25.0% |
Similar Demographics by Unemployment Among Ages 30 to 34 years
Demographics Similar to Indonesians by Unemployment Among Ages 30 to 34 years
In terms of unemployment among ages 30 to 34 years, the demographic groups most similar to Indonesians are Immigrants from Lithuania (5.2%, a difference of 0.050%), Uruguayan (5.2%, a difference of 0.13%), Immigrants from Indonesia (5.2%, a difference of 0.15%), Scandinavian (5.2%, a difference of 0.20%), and Chilean (5.2%, a difference of 0.25%).
| Demographics | Rating | Rank | Unemployment Among Ages 30 to 34 years |
| Paraguayans | 96.4 /100 | #71 | Exceptional 5.1% |
| Immigrants | Moldova | 96.4 /100 | #72 | Exceptional 5.1% |
| Slovenes | 96.2 /100 | #73 | Exceptional 5.2% |
| Immigrants | Asia | 96.2 /100 | #74 | Exceptional 5.2% |
| Iranians | 96.0 /100 | #75 | Exceptional 5.2% |
| Scandinavians | 95.6 /100 | #76 | Exceptional 5.2% |
| Uruguayans | 95.4 /100 | #77 | Exceptional 5.2% |
| Indonesians | 95.1 /100 | #78 | Exceptional 5.2% |
| Immigrants | Lithuania | 95.0 /100 | #79 | Exceptional 5.2% |
| Immigrants | Indonesia | 94.7 /100 | #80 | Exceptional 5.2% |
| Chileans | 94.4 /100 | #81 | Exceptional 5.2% |
| Immigrants | Latvia | 94.2 /100 | #82 | Exceptional 5.2% |
| Immigrants | Korea | 94.1 /100 | #83 | Exceptional 5.2% |
| Immigrants | Uganda | 94.0 /100 | #84 | Exceptional 5.2% |
| Immigrants | Egypt | 93.9 /100 | #85 | Exceptional 5.2% |
Demographics Similar to Irish by Unemployment Among Ages 30 to 34 years
In terms of unemployment among ages 30 to 34 years, the demographic groups most similar to Irish are Moroccan (5.5%, a difference of 0.0%), Immigrants from Africa (5.5%, a difference of 0.020%), Slavic (5.5%, a difference of 0.030%), Finnish (5.5%, a difference of 0.050%), and Immigrants from South America (5.5%, a difference of 0.12%).
| Demographics | Rating | Rank | Unemployment Among Ages 30 to 34 years |
| Malaysians | 41.8 /100 | #184 | Average 5.5% |
| Immigrants | Western Europe | 39.1 /100 | #185 | Fair 5.5% |
| Canadians | 38.2 /100 | #186 | Fair 5.5% |
| Immigrants | Western Asia | 38.2 /100 | #187 | Fair 5.5% |
| Immigrants | Norway | 36.1 /100 | #188 | Fair 5.5% |
| Immigrants | England | 35.7 /100 | #189 | Fair 5.5% |
| Immigrants | Kazakhstan | 33.9 /100 | #190 | Fair 5.5% |
| Irish | 31.3 /100 | #191 | Fair 5.5% |
| Moroccans | 31.2 /100 | #192 | Fair 5.5% |
| Immigrants | Africa | 31.0 /100 | #193 | Fair 5.5% |
| Slavs | 30.9 /100 | #194 | Fair 5.5% |
| Finns | 30.7 /100 | #195 | Fair 5.5% |
| Immigrants | South America | 29.8 /100 | #196 | Fair 5.5% |
| Immigrants | Nicaragua | 28.9 /100 | #197 | Fair 5.5% |
| Immigrants | Afghanistan | 27.2 /100 | #198 | Fair 5.6% |