Immigrants from South America vs Irish Male Disability
COMPARE
Immigrants from South America
Irish
Male Disability
Male Disability Comparison
Immigrants from South America
Irish
10.4%
MALE DISABILITY
99.6/ 100
METRIC RATING
57th/ 347
METRIC RANK
12.7%
MALE DISABILITY
0.0/ 100
METRIC RATING
282nd/ 347
METRIC RANK
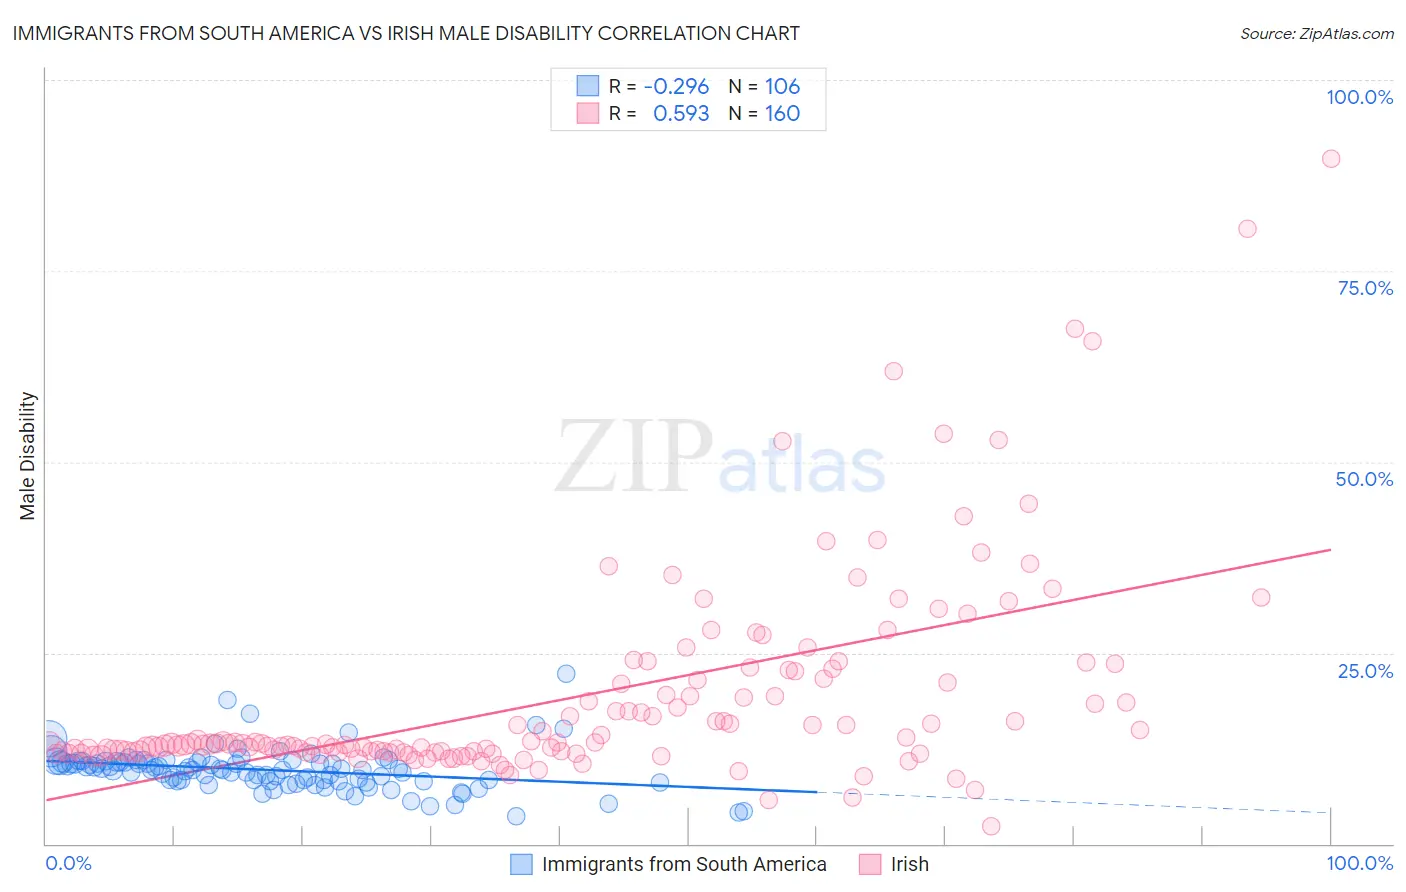
Immigrants from South America vs Irish Male Disability Correlation Chart
The statistical analysis conducted on geographies consisting of 486,285,750 people shows a weak negative correlation between the proportion of Immigrants from South America and percentage of males with a disability in the United States with a correlation coefficient (R) of -0.296 and weighted average of 10.4%. Similarly, the statistical analysis conducted on geographies consisting of 580,201,634 people shows a substantial positive correlation between the proportion of Irish and percentage of males with a disability in the United States with a correlation coefficient (R) of 0.593 and weighted average of 12.7%, a difference of 22.5%.
Male Disability Correlation Summary
| Measurement | Immigrants from South America | Irish |
| Minimum | 3.7% | 2.4% |
| Maximum | 22.2% | 89.8% |
| Range | 18.6% | 87.4% |
| Mean | 9.7% | 19.1% |
| Median | 9.7% | 13.1% |
| Interquartile 25% (IQ1) | 8.3% | 12.0% |
| Interquartile 75% (IQ3) | 10.7% | 21.6% |
| Interquartile Range (IQR) | 2.5% | 9.5% |
| Standard Deviation (Sample) | 2.7% | 13.6% |
| Standard Deviation (Population) | 2.7% | 13.5% |
Similar Demographics by Male Disability
Demographics Similar to Immigrants from South America by Male Disability
In terms of male disability, the demographic groups most similar to Immigrants from South America are Tongan (10.4%, a difference of 0.020%), Immigrants from Eritrea (10.4%, a difference of 0.060%), Immigrants from Japan (10.4%, a difference of 0.070%), Peruvian (10.4%, a difference of 0.080%), and Immigrants from Uzbekistan (10.4%, a difference of 0.12%).
| Demographics | Rating | Rank | Male Disability |
| South Americans | 99.6 /100 | #50 | Exceptional 10.3% |
| Salvadorans | 99.6 /100 | #51 | Exceptional 10.4% |
| Immigrants | Saudi Arabia | 99.6 /100 | #52 | Exceptional 10.4% |
| Immigrants | Uzbekistan | 99.6 /100 | #53 | Exceptional 10.4% |
| Peruvians | 99.6 /100 | #54 | Exceptional 10.4% |
| Immigrants | Eritrea | 99.6 /100 | #55 | Exceptional 10.4% |
| Tongans | 99.6 /100 | #56 | Exceptional 10.4% |
| Immigrants | South America | 99.6 /100 | #57 | Exceptional 10.4% |
| Immigrants | Japan | 99.5 /100 | #58 | Exceptional 10.4% |
| Immigrants | Australia | 99.5 /100 | #59 | Exceptional 10.4% |
| Immigrants | Colombia | 99.5 /100 | #60 | Exceptional 10.4% |
| Immigrants | Northern Africa | 99.4 /100 | #61 | Exceptional 10.4% |
| Immigrants | Ecuador | 99.3 /100 | #62 | Exceptional 10.4% |
| Immigrants | Belarus | 99.3 /100 | #63 | Exceptional 10.4% |
| Jordanians | 99.3 /100 | #64 | Exceptional 10.5% |
Demographics Similar to Irish by Male Disability
In terms of male disability, the demographic groups most similar to Irish are German (12.7%, a difference of 0.010%), Sioux (12.7%, a difference of 0.060%), Dutch (12.7%, a difference of 0.11%), Slovak (12.7%, a difference of 0.16%), and Spanish (12.7%, a difference of 0.28%).
| Demographics | Rating | Rank | Male Disability |
| Fijians | 0.0 /100 | #275 | Tragic 12.6% |
| Africans | 0.0 /100 | #276 | Tragic 12.6% |
| Finns | 0.0 /100 | #277 | Tragic 12.6% |
| Central American Indians | 0.0 /100 | #278 | Tragic 12.7% |
| Slovaks | 0.0 /100 | #279 | Tragic 12.7% |
| Dutch | 0.0 /100 | #280 | Tragic 12.7% |
| Sioux | 0.0 /100 | #281 | Tragic 12.7% |
| Irish | 0.0 /100 | #282 | Tragic 12.7% |
| Germans | 0.0 /100 | #283 | Tragic 12.7% |
| Spanish | 0.0 /100 | #284 | Tragic 12.7% |
| Welsh | 0.0 /100 | #285 | Tragic 12.7% |
| Scottish | 0.0 /100 | #286 | Tragic 12.8% |
| Cape Verdeans | 0.0 /100 | #287 | Tragic 12.8% |
| Yup'ik | 0.0 /100 | #288 | Tragic 12.8% |
| Immigrants | Cabo Verde | 0.0 /100 | #289 | Tragic 12.8% |