Indonesian vs Immigrants from Latvia Unemployment Among Women with Children Under 6 years
COMPARE
Indonesian
Immigrants from Latvia
Unemployment Among Women with Children Under 6 years
Unemployment Among Women with Children Under 6 years Comparison
Indonesians
Immigrants from Latvia
7.7%
UNEMPLOYMENT AMONG WOMEN WITH CHILDREN UNDER 6 YEARS
40.5/ 100
METRIC RATING
184th/ 347
METRIC RANK
6.8%
UNEMPLOYMENT AMONG WOMEN WITH CHILDREN UNDER 6 YEARS
99.9/ 100
METRIC RATING
54th/ 347
METRIC RANK
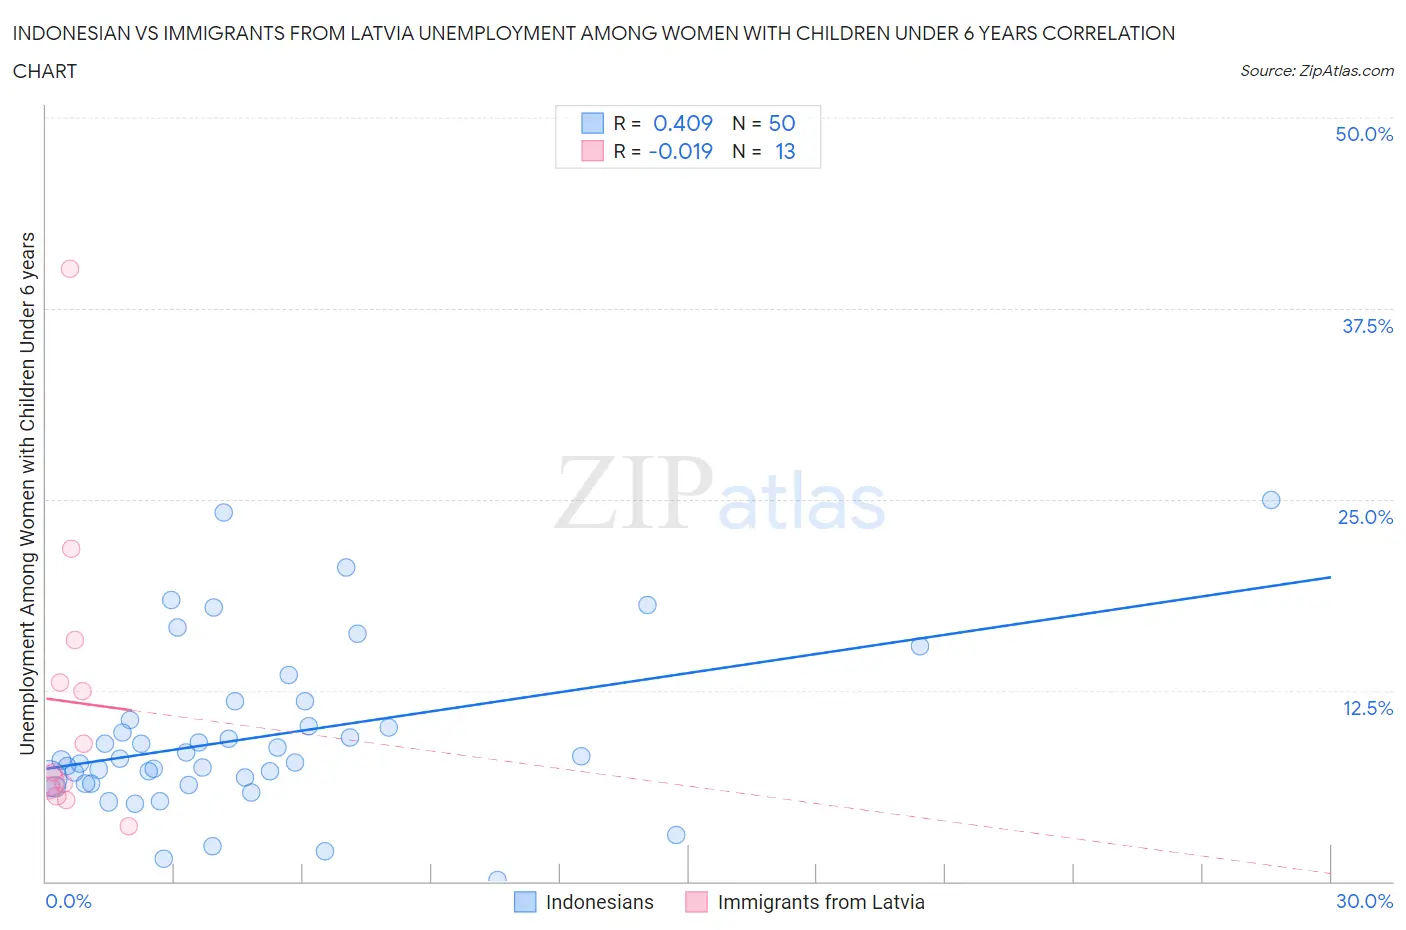
Indonesian vs Immigrants from Latvia Unemployment Among Women with Children Under 6 years Correlation Chart
The statistical analysis conducted on geographies consisting of 144,580,438 people shows a moderate positive correlation between the proportion of Indonesians and unemployment rate among women with children under the age of 6 in the United States with a correlation coefficient (R) of 0.409 and weighted average of 7.7%. Similarly, the statistical analysis conducted on geographies consisting of 99,406,328 people shows no correlation between the proportion of Immigrants from Latvia and unemployment rate among women with children under the age of 6 in the United States with a correlation coefficient (R) of -0.019 and weighted average of 6.8%, a difference of 13.0%.
Unemployment Among Women with Children Under 6 years Correlation Summary
| Measurement | Indonesian | Immigrants from Latvia |
| Minimum | 0.10% | 3.6% |
| Maximum | 25.0% | 40.1% |
| Range | 24.9% | 36.5% |
| Mean | 9.5% | 11.7% |
| Median | 8.0% | 7.1% |
| Interquartile 25% (IQ1) | 6.4% | 5.9% |
| Interquartile 75% (IQ3) | 10.6% | 14.4% |
| Interquartile Range (IQR) | 4.2% | 8.5% |
| Standard Deviation (Sample) | 5.4% | 9.9% |
| Standard Deviation (Population) | 5.4% | 9.6% |
Similar Demographics by Unemployment Among Women with Children Under 6 years
Demographics Similar to Indonesians by Unemployment Among Women with Children Under 6 years
In terms of unemployment among women with children under 6 years, the demographic groups most similar to Indonesians are Spanish American (7.7%, a difference of 0.060%), Yugoslavian (7.7%, a difference of 0.080%), Immigrants from Thailand (7.7%, a difference of 0.14%), Czechoslovakian (7.7%, a difference of 0.14%), and Sierra Leonean (7.7%, a difference of 0.16%).
| Demographics | Rating | Rank | Unemployment Among Women with Children Under 6 years |
| Austrians | 46.0 /100 | #177 | Average 7.7% |
| Immigrants | England | 45.4 /100 | #178 | Average 7.7% |
| Immigrants | Western Europe | 44.9 /100 | #179 | Average 7.7% |
| Immigrants | Uruguay | 44.5 /100 | #180 | Average 7.7% |
| Brazilians | 43.9 /100 | #181 | Average 7.7% |
| Nepalese | 43.5 /100 | #182 | Average 7.7% |
| Sierra Leoneans | 42.9 /100 | #183 | Average 7.7% |
| Indonesians | 40.5 /100 | #184 | Average 7.7% |
| Spanish Americans | 39.7 /100 | #185 | Fair 7.7% |
| Yugoslavians | 39.4 /100 | #186 | Fair 7.7% |
| Immigrants | Thailand | 38.5 /100 | #187 | Fair 7.7% |
| Czechoslovakians | 38.4 /100 | #188 | Fair 7.7% |
| Immigrants | Panama | 35.7 /100 | #189 | Fair 7.7% |
| Immigrants | North Macedonia | 34.4 /100 | #190 | Fair 7.7% |
| Immigrants | Austria | 32.4 /100 | #191 | Fair 7.7% |
Demographics Similar to Immigrants from Latvia by Unemployment Among Women with Children Under 6 years
In terms of unemployment among women with children under 6 years, the demographic groups most similar to Immigrants from Latvia are Chinese (6.8%, a difference of 0.17%), Immigrants from Iran (6.8%, a difference of 0.25%), Ethiopian (6.8%, a difference of 0.36%), Immigrants from Ireland (6.8%, a difference of 0.38%), and Immigrants from Nepal (6.8%, a difference of 0.39%).
| Demographics | Rating | Rank | Unemployment Among Women with Children Under 6 years |
| Immigrants | Asia | 99.9 /100 | #47 | Exceptional 6.8% |
| Immigrants | Switzerland | 99.9 /100 | #48 | Exceptional 6.8% |
| Immigrants | Nepal | 99.9 /100 | #49 | Exceptional 6.8% |
| Immigrants | Ireland | 99.9 /100 | #50 | Exceptional 6.8% |
| Ethiopians | 99.9 /100 | #51 | Exceptional 6.8% |
| Immigrants | Iran | 99.9 /100 | #52 | Exceptional 6.8% |
| Chinese | 99.9 /100 | #53 | Exceptional 6.8% |
| Immigrants | Latvia | 99.9 /100 | #54 | Exceptional 6.8% |
| Immigrants | Ukraine | 99.8 /100 | #55 | Exceptional 6.8% |
| Immigrants | Ethiopia | 99.8 /100 | #56 | Exceptional 6.9% |
| Icelanders | 99.8 /100 | #57 | Exceptional 6.9% |
| Immigrants | Turkey | 99.8 /100 | #58 | Exceptional 6.9% |
| Immigrants | Serbia | 99.8 /100 | #59 | Exceptional 6.9% |
| Immigrants | Sri Lanka | 99.8 /100 | #60 | Exceptional 6.9% |
| Immigrants | France | 99.7 /100 | #61 | Exceptional 6.9% |