Indonesian vs Immigrants from El Salvador Hearing Disability
COMPARE
Indonesian
Immigrants from El Salvador
Hearing Disability
Hearing Disability Comparison
Indonesians
Immigrants from El Salvador
3.0%
HEARING DISABILITY
50.0/ 100
METRIC RATING
174th/ 347
METRIC RANK
2.6%
HEARING DISABILITY
99.7/ 100
METRIC RATING
25th/ 347
METRIC RANK
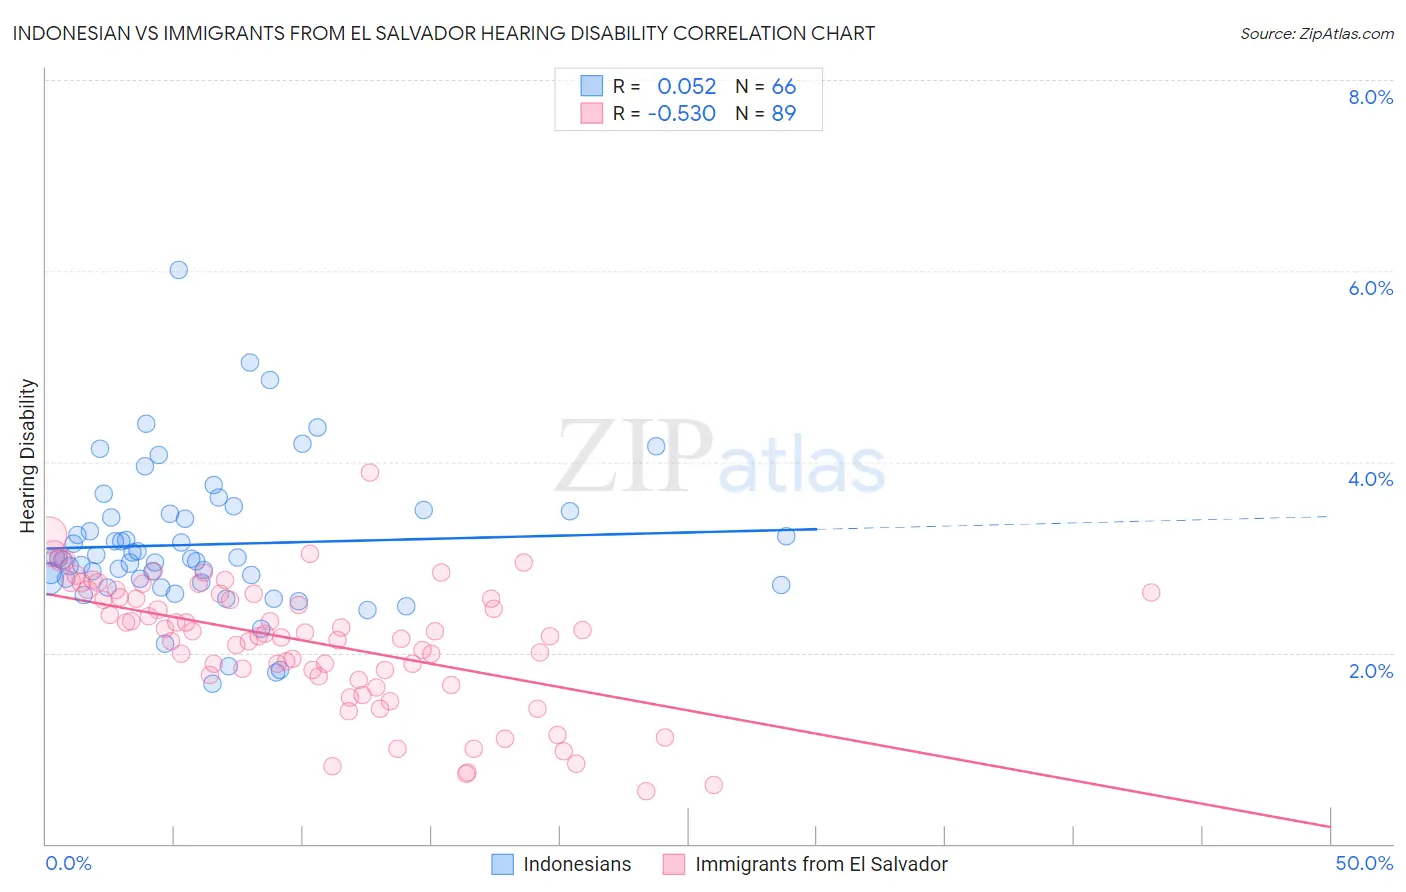
Indonesian vs Immigrants from El Salvador Hearing Disability Correlation Chart
The statistical analysis conducted on geographies consisting of 162,712,872 people shows a slight positive correlation between the proportion of Indonesians and percentage of population with hearing disability in the United States with a correlation coefficient (R) of 0.052 and weighted average of 3.0%. Similarly, the statistical analysis conducted on geographies consisting of 357,678,057 people shows a substantial negative correlation between the proportion of Immigrants from El Salvador and percentage of population with hearing disability in the United States with a correlation coefficient (R) of -0.530 and weighted average of 2.6%, a difference of 16.1%.
Hearing Disability Correlation Summary
| Measurement | Indonesian | Immigrants from El Salvador |
| Minimum | 1.7% | 0.55% |
| Maximum | 6.0% | 3.9% |
| Range | 4.3% | 3.3% |
| Mean | 3.1% | 2.1% |
| Median | 3.0% | 2.2% |
| Interquartile 25% (IQ1) | 2.7% | 1.8% |
| Interquartile 75% (IQ3) | 3.5% | 2.6% |
| Interquartile Range (IQR) | 0.72% | 0.86% |
| Standard Deviation (Sample) | 0.76% | 0.67% |
| Standard Deviation (Population) | 0.76% | 0.66% |
Similar Demographics by Hearing Disability
Demographics Similar to Indonesians by Hearing Disability
In terms of hearing disability, the demographic groups most similar to Indonesians are Immigrants from Serbia (3.0%, a difference of 0.10%), Immigrants from Romania (3.0%, a difference of 0.15%), Panamanian (3.0%, a difference of 0.28%), Immigrants from Philippines (3.0%, a difference of 0.34%), and Japanese (3.0%, a difference of 0.38%).
| Demographics | Rating | Rank | Hearing Disability |
| Immigrants | Eastern Europe | 58.1 /100 | #167 | Average 3.0% |
| Immigrants | Greece | 57.9 /100 | #168 | Average 3.0% |
| Arabs | 57.6 /100 | #169 | Average 3.0% |
| Immigrants | Cabo Verde | 56.9 /100 | #170 | Average 3.0% |
| Immigrants | Ukraine | 56.6 /100 | #171 | Average 3.0% |
| Armenians | 56.0 /100 | #172 | Average 3.0% |
| Immigrants | Serbia | 51.1 /100 | #173 | Average 3.0% |
| Indonesians | 50.0 /100 | #174 | Average 3.0% |
| Immigrants | Romania | 48.4 /100 | #175 | Average 3.0% |
| Panamanians | 47.0 /100 | #176 | Average 3.0% |
| Immigrants | Philippines | 46.4 /100 | #177 | Average 3.0% |
| Japanese | 46.0 /100 | #178 | Average 3.0% |
| Immigrants | Moldova | 43.1 /100 | #179 | Average 3.0% |
| Immigrants | Sweden | 42.4 /100 | #180 | Average 3.0% |
| Immigrants | Belgium | 41.5 /100 | #181 | Average 3.0% |
Demographics Similar to Immigrants from El Salvador by Hearing Disability
In terms of hearing disability, the demographic groups most similar to Immigrants from El Salvador are Immigrants from Senegal (2.6%, a difference of 0.010%), Immigrants from South Central Asia (2.6%, a difference of 0.050%), Immigrants from Ghana (2.6%, a difference of 0.40%), Immigrants from Haiti (2.6%, a difference of 0.42%), and Bolivian (2.6%, a difference of 0.45%).
| Demographics | Rating | Rank | Hearing Disability |
| Dominicans | 99.8 /100 | #18 | Exceptional 2.5% |
| Thais | 99.8 /100 | #19 | Exceptional 2.5% |
| Immigrants | Bolivia | 99.8 /100 | #20 | Exceptional 2.5% |
| Ghanaians | 99.8 /100 | #21 | Exceptional 2.5% |
| Immigrants | Sierra Leone | 99.8 /100 | #22 | Exceptional 2.6% |
| Immigrants | Nigeria | 99.8 /100 | #23 | Exceptional 2.6% |
| Immigrants | Ghana | 99.8 /100 | #24 | Exceptional 2.6% |
| Immigrants | El Salvador | 99.7 /100 | #25 | Exceptional 2.6% |
| Immigrants | Senegal | 99.7 /100 | #26 | Exceptional 2.6% |
| Immigrants | South Central Asia | 99.7 /100 | #27 | Exceptional 2.6% |
| Immigrants | Haiti | 99.7 /100 | #28 | Exceptional 2.6% |
| Bolivians | 99.7 /100 | #29 | Exceptional 2.6% |
| Immigrants | Caribbean | 99.7 /100 | #30 | Exceptional 2.6% |
| Immigrants | Cameroon | 99.7 /100 | #31 | Exceptional 2.6% |
| Immigrants | Venezuela | 99.7 /100 | #32 | Exceptional 2.6% |