Indonesian vs Norwegian Hearing Disability
COMPARE
Indonesian
Norwegian
Hearing Disability
Hearing Disability Comparison
Indonesians
Norwegians
3.0%
HEARING DISABILITY
50.0/ 100
METRIC RATING
174th/ 347
METRIC RANK
3.7%
HEARING DISABILITY
0.0/ 100
METRIC RATING
293rd/ 347
METRIC RANK
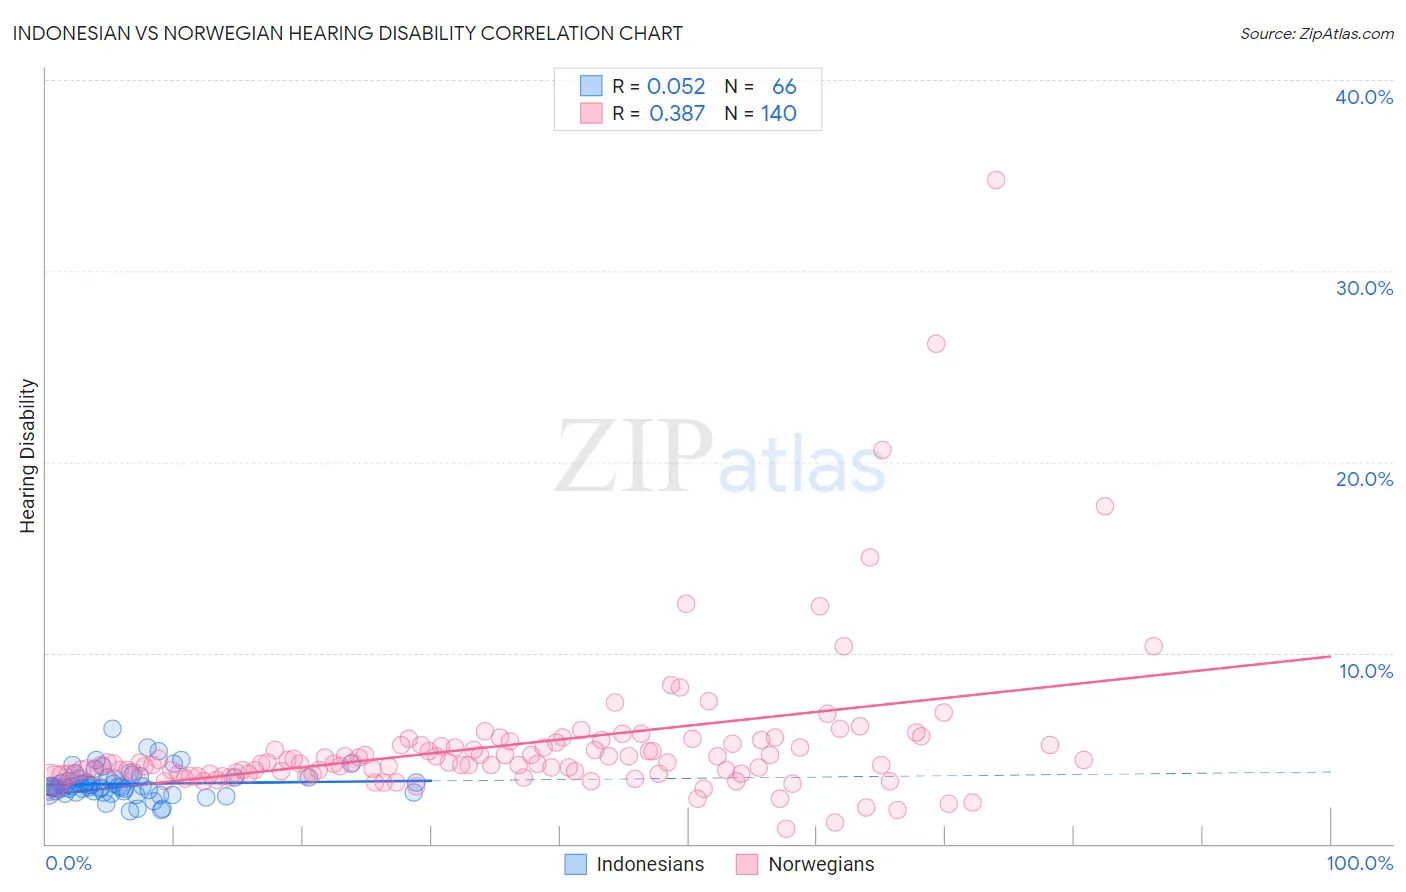
Indonesian vs Norwegian Hearing Disability Correlation Chart
The statistical analysis conducted on geographies consisting of 162,712,872 people shows a slight positive correlation between the proportion of Indonesians and percentage of population with hearing disability in the United States with a correlation coefficient (R) of 0.052 and weighted average of 3.0%. Similarly, the statistical analysis conducted on geographies consisting of 532,928,567 people shows a mild positive correlation between the proportion of Norwegians and percentage of population with hearing disability in the United States with a correlation coefficient (R) of 0.387 and weighted average of 3.7%, a difference of 23.2%.
Hearing Disability Correlation Summary
| Measurement | Indonesian | Norwegian |
| Minimum | 1.7% | 0.76% |
| Maximum | 6.0% | 34.8% |
| Range | 4.3% | 34.0% |
| Mean | 3.1% | 5.2% |
| Median | 3.0% | 4.2% |
| Interquartile 25% (IQ1) | 2.7% | 3.7% |
| Interquartile 75% (IQ3) | 3.5% | 5.1% |
| Interquartile Range (IQR) | 0.72% | 1.5% |
| Standard Deviation (Sample) | 0.76% | 4.0% |
| Standard Deviation (Population) | 0.76% | 4.0% |
Similar Demographics by Hearing Disability
Demographics Similar to Indonesians by Hearing Disability
In terms of hearing disability, the demographic groups most similar to Indonesians are Immigrants from Serbia (3.0%, a difference of 0.10%), Immigrants from Romania (3.0%, a difference of 0.15%), Panamanian (3.0%, a difference of 0.28%), Immigrants from Philippines (3.0%, a difference of 0.34%), and Japanese (3.0%, a difference of 0.38%).
| Demographics | Rating | Rank | Hearing Disability |
| Immigrants | Eastern Europe | 58.1 /100 | #167 | Average 3.0% |
| Immigrants | Greece | 57.9 /100 | #168 | Average 3.0% |
| Arabs | 57.6 /100 | #169 | Average 3.0% |
| Immigrants | Cabo Verde | 56.9 /100 | #170 | Average 3.0% |
| Immigrants | Ukraine | 56.6 /100 | #171 | Average 3.0% |
| Armenians | 56.0 /100 | #172 | Average 3.0% |
| Immigrants | Serbia | 51.1 /100 | #173 | Average 3.0% |
| Indonesians | 50.0 /100 | #174 | Average 3.0% |
| Immigrants | Romania | 48.4 /100 | #175 | Average 3.0% |
| Panamanians | 47.0 /100 | #176 | Average 3.0% |
| Immigrants | Philippines | 46.4 /100 | #177 | Average 3.0% |
| Japanese | 46.0 /100 | #178 | Average 3.0% |
| Immigrants | Moldova | 43.1 /100 | #179 | Average 3.0% |
| Immigrants | Sweden | 42.4 /100 | #180 | Average 3.0% |
| Immigrants | Belgium | 41.5 /100 | #181 | Average 3.0% |
Demographics Similar to Norwegians by Hearing Disability
In terms of hearing disability, the demographic groups most similar to Norwegians are Native Hawaiian (3.7%, a difference of 0.060%), Finnish (3.7%, a difference of 0.12%), White/Caucasian (3.7%, a difference of 0.13%), Iroquois (3.7%, a difference of 0.24%), and Chinese (3.7%, a difference of 0.27%).
| Demographics | Rating | Rank | Hearing Disability |
| Delaware | 0.0 /100 | #286 | Tragic 3.6% |
| Spanish | 0.0 /100 | #287 | Tragic 3.7% |
| Irish | 0.0 /100 | #288 | Tragic 3.7% |
| Chinese | 0.0 /100 | #289 | Tragic 3.7% |
| Whites/Caucasians | 0.0 /100 | #290 | Tragic 3.7% |
| Finns | 0.0 /100 | #291 | Tragic 3.7% |
| Native Hawaiians | 0.0 /100 | #292 | Tragic 3.7% |
| Norwegians | 0.0 /100 | #293 | Tragic 3.7% |
| Iroquois | 0.0 /100 | #294 | Tragic 3.7% |
| Welsh | 0.0 /100 | #295 | Tragic 3.7% |
| Pima | 0.0 /100 | #296 | Tragic 3.7% |
| Immigrants | Azores | 0.0 /100 | #297 | Tragic 3.7% |
| Celtics | 0.0 /100 | #298 | Tragic 3.7% |
| Germans | 0.0 /100 | #299 | Tragic 3.7% |
| Scottish | 0.0 /100 | #300 | Tragic 3.7% |