Indian (Asian) vs French Canadian Cognitive Disability
COMPARE
Indian (Asian)
French Canadian
Cognitive Disability
Cognitive Disability Comparison
Indians (Asian)
French Canadians
16.8%
COGNITIVE DISABILITY
97.2/ 100
METRIC RATING
112th/ 347
METRIC RANK
17.1%
COGNITIVE DISABILITY
85.7/ 100
METRIC RATING
148th/ 347
METRIC RANK
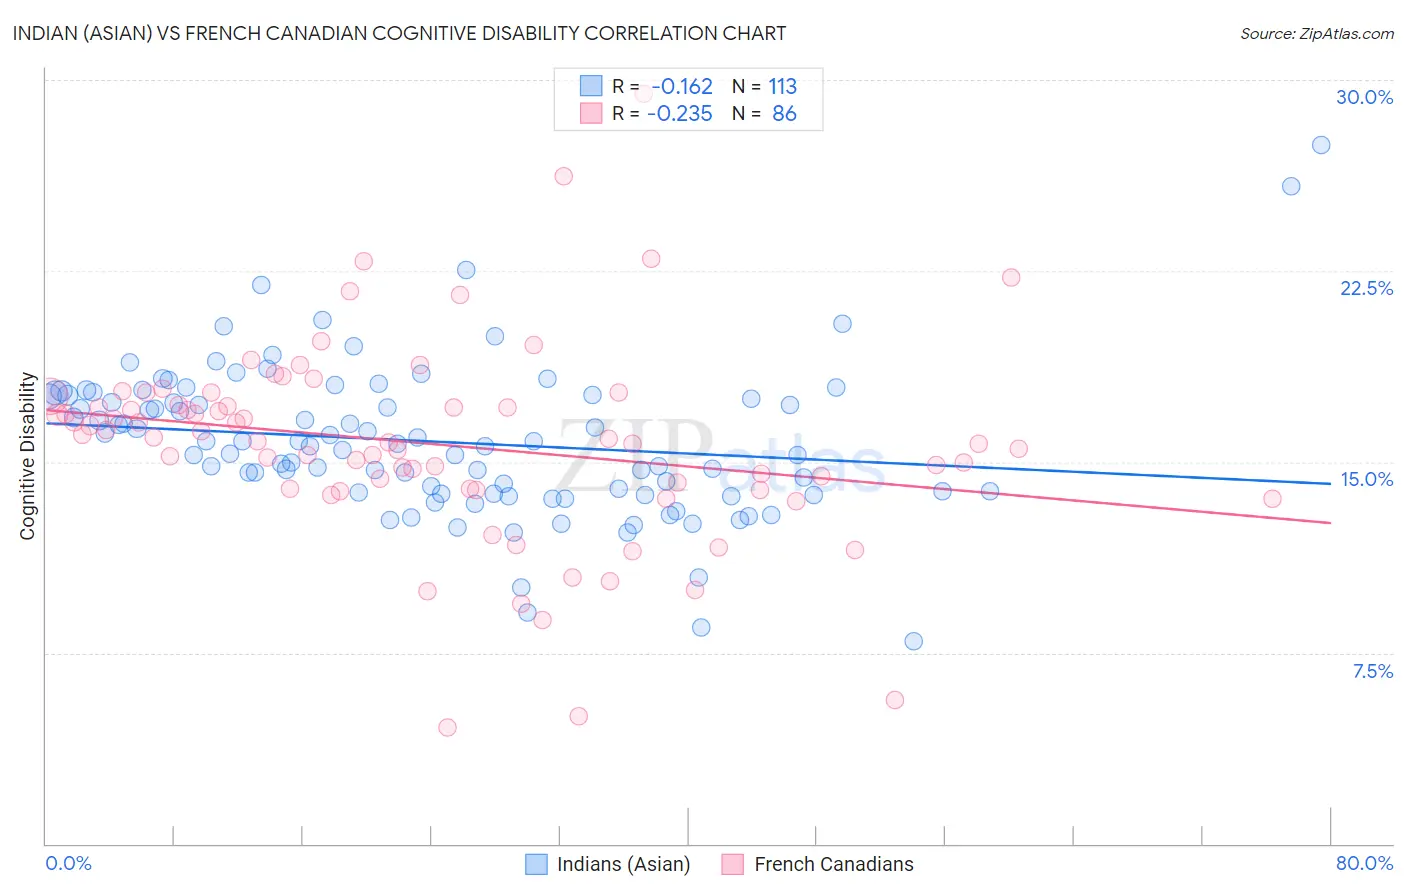
Indian (Asian) vs French Canadian Cognitive Disability Correlation Chart
The statistical analysis conducted on geographies consisting of 495,263,567 people shows a poor negative correlation between the proportion of Indians (Asian) and percentage of population with cognitive disability in the United States with a correlation coefficient (R) of -0.162 and weighted average of 16.8%. Similarly, the statistical analysis conducted on geographies consisting of 502,569,589 people shows a weak negative correlation between the proportion of French Canadians and percentage of population with cognitive disability in the United States with a correlation coefficient (R) of -0.235 and weighted average of 17.1%, a difference of 1.3%.
Cognitive Disability Correlation Summary
| Measurement | Indian (Asian) | French Canadian |
| Minimum | 8.0% | 4.5% |
| Maximum | 27.5% | 29.5% |
| Range | 19.5% | 24.9% |
| Mean | 15.8% | 15.7% |
| Median | 15.7% | 15.9% |
| Interquartile 25% (IQ1) | 13.8% | 13.9% |
| Interquartile 75% (IQ3) | 17.6% | 17.3% |
| Interquartile Range (IQR) | 3.8% | 3.3% |
| Standard Deviation (Sample) | 3.0% | 4.0% |
| Standard Deviation (Population) | 3.0% | 3.9% |
Similar Demographics by Cognitive Disability
Demographics Similar to Indians (Asian) by Cognitive Disability
In terms of cognitive disability, the demographic groups most similar to Indians (Asian) are Immigrants from Sri Lanka (16.8%, a difference of 0.0%), Korean (16.8%, a difference of 0.010%), Uruguayan (16.8%, a difference of 0.020%), Albanian (16.8%, a difference of 0.040%), and Arapaho (16.8%, a difference of 0.040%).
| Demographics | Rating | Rank | Cognitive Disability |
| Immigrants | Eastern Asia | 97.9 /100 | #105 | Exceptional 16.8% |
| Northern Europeans | 97.8 /100 | #106 | Exceptional 16.8% |
| Immigrants | Nicaragua | 97.8 /100 | #107 | Exceptional 16.8% |
| Canadians | 97.5 /100 | #108 | Exceptional 16.8% |
| Albanians | 97.3 /100 | #109 | Exceptional 16.8% |
| Arapaho | 97.3 /100 | #110 | Exceptional 16.8% |
| Uruguayans | 97.2 /100 | #111 | Exceptional 16.8% |
| Indians (Asian) | 97.2 /100 | #112 | Exceptional 16.8% |
| Immigrants | Sri Lanka | 97.1 /100 | #113 | Exceptional 16.8% |
| Koreans | 97.1 /100 | #114 | Exceptional 16.8% |
| Yup'ik | 96.9 /100 | #115 | Exceptional 16.9% |
| Inupiat | 96.5 /100 | #116 | Exceptional 16.9% |
| Immigrants | Japan | 96.2 /100 | #117 | Exceptional 16.9% |
| Immigrants | Denmark | 96.2 /100 | #118 | Exceptional 16.9% |
| South Africans | 95.5 /100 | #119 | Exceptional 16.9% |
Demographics Similar to French Canadians by Cognitive Disability
In terms of cognitive disability, the demographic groups most similar to French Canadians are Cypriot (17.1%, a difference of 0.0%), Scotch-Irish (17.1%, a difference of 0.010%), Basque (17.1%, a difference of 0.010%), Costa Rican (17.0%, a difference of 0.14%), and Syrian (17.1%, a difference of 0.15%).
| Demographics | Rating | Rank | Cognitive Disability |
| Aleuts | 89.9 /100 | #141 | Excellent 17.0% |
| Carpatho Rusyns | 89.6 /100 | #142 | Excellent 17.0% |
| British | 89.3 /100 | #143 | Excellent 17.0% |
| Immigrants | Brazil | 89.3 /100 | #144 | Excellent 17.0% |
| Immigrants | South Eastern Asia | 88.7 /100 | #145 | Excellent 17.0% |
| Costa Ricans | 88.0 /100 | #146 | Excellent 17.0% |
| Scotch-Irish | 85.9 /100 | #147 | Excellent 17.1% |
| French Canadians | 85.7 /100 | #148 | Excellent 17.1% |
| Cypriots | 85.7 /100 | #149 | Excellent 17.1% |
| Basques | 85.5 /100 | #150 | Excellent 17.1% |
| Syrians | 83.0 /100 | #151 | Excellent 17.1% |
| Immigrants | Indonesia | 82.7 /100 | #152 | Excellent 17.1% |
| Immigrants | Kazakhstan | 80.5 /100 | #153 | Excellent 17.1% |
| Immigrants | Malaysia | 79.3 /100 | #154 | Good 17.1% |
| Brazilians | 78.9 /100 | #155 | Good 17.1% |