Indian (Asian) vs Immigrants from Germany Cognitive Disability
COMPARE
Indian (Asian)
Immigrants from Germany
Cognitive Disability
Cognitive Disability Comparison
Indians (Asian)
Immigrants from Germany
16.8%
COGNITIVE DISABILITY
97.2/ 100
METRIC RATING
112th/ 347
METRIC RANK
17.0%
COGNITIVE DISABILITY
92.1/ 100
METRIC RATING
131st/ 347
METRIC RANK
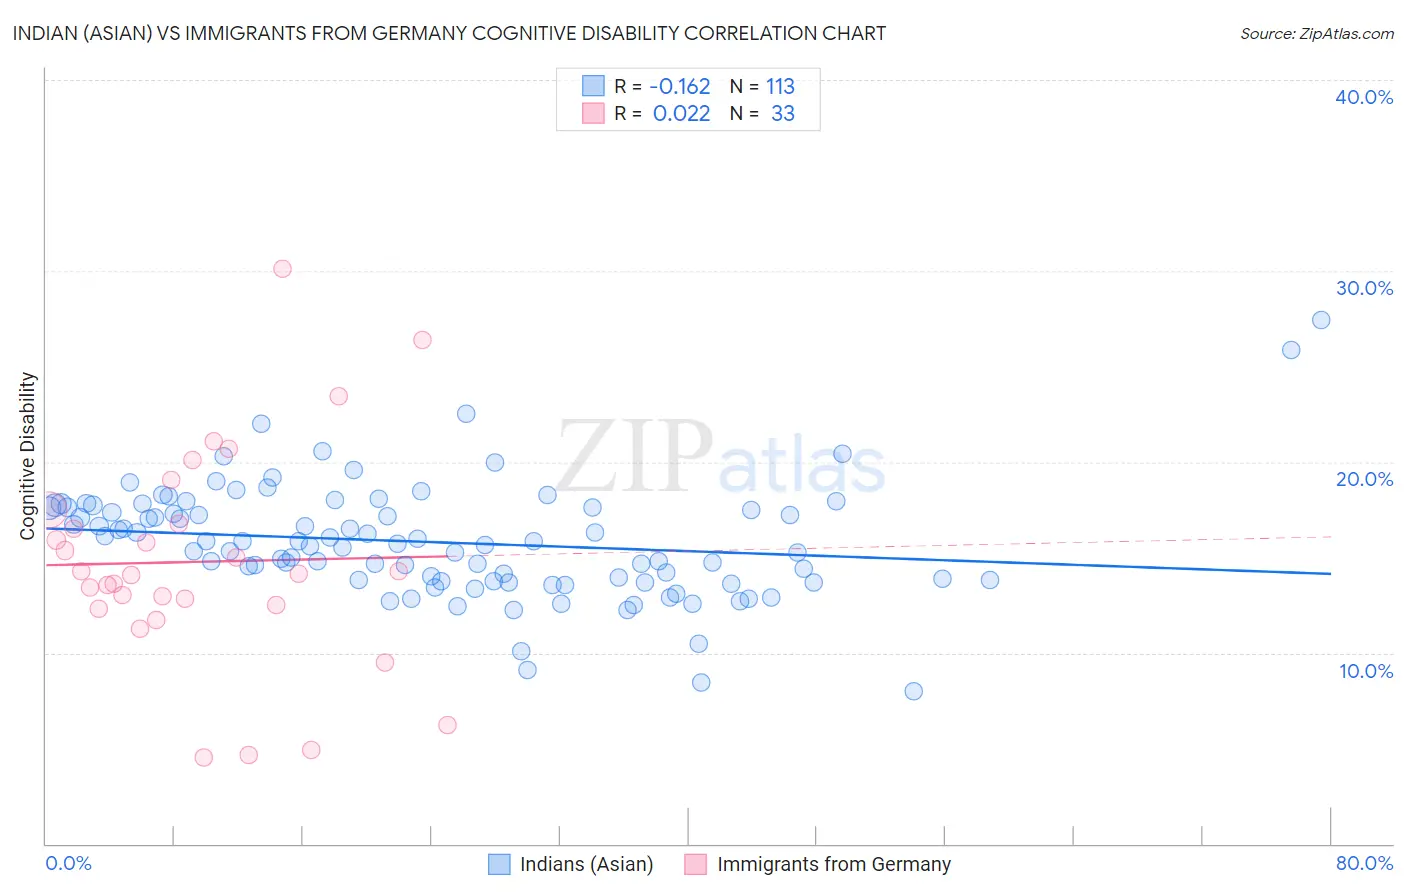
Indian (Asian) vs Immigrants from Germany Cognitive Disability Correlation Chart
The statistical analysis conducted on geographies consisting of 495,263,567 people shows a poor negative correlation between the proportion of Indians (Asian) and percentage of population with cognitive disability in the United States with a correlation coefficient (R) of -0.162 and weighted average of 16.8%. Similarly, the statistical analysis conducted on geographies consisting of 463,867,197 people shows no correlation between the proportion of Immigrants from Germany and percentage of population with cognitive disability in the United States with a correlation coefficient (R) of 0.022 and weighted average of 17.0%, a difference of 0.78%.
Cognitive Disability Correlation Summary
| Measurement | Indian (Asian) | Immigrants from Germany |
| Minimum | 8.0% | 4.5% |
| Maximum | 27.5% | 30.1% |
| Range | 19.5% | 25.7% |
| Mean | 15.8% | 14.8% |
| Median | 15.7% | 14.1% |
| Interquartile 25% (IQ1) | 13.8% | 12.4% |
| Interquartile 75% (IQ3) | 17.6% | 17.1% |
| Interquartile Range (IQR) | 3.8% | 4.7% |
| Standard Deviation (Sample) | 3.0% | 5.7% |
| Standard Deviation (Population) | 3.0% | 5.6% |
Demographics Similar to Indians (Asian) and Immigrants from Germany by Cognitive Disability
In terms of cognitive disability, the demographic groups most similar to Indians (Asian) are Immigrants from Sri Lanka (16.8%, a difference of 0.0%), Korean (16.8%, a difference of 0.010%), Uruguayan (16.8%, a difference of 0.020%), Yup'ik (16.9%, a difference of 0.060%), and Inupiat (16.9%, a difference of 0.16%). Similarly, the demographic groups most similar to Immigrants from Germany are Immigrants from Vietnam (17.0%, a difference of 0.020%), Immigrants from Uruguay (17.0%, a difference of 0.080%), Nicaraguan (17.0%, a difference of 0.090%), Immigrants from Costa Rica (17.0%, a difference of 0.11%), and European (17.0%, a difference of 0.14%).
| Demographics | Rating | Rank | Cognitive Disability |
| Uruguayans | 97.2 /100 | #111 | Exceptional 16.8% |
| Indians (Asian) | 97.2 /100 | #112 | Exceptional 16.8% |
| Immigrants | Sri Lanka | 97.1 /100 | #113 | Exceptional 16.8% |
| Koreans | 97.1 /100 | #114 | Exceptional 16.8% |
| Yup'ik | 96.9 /100 | #115 | Exceptional 16.9% |
| Inupiat | 96.5 /100 | #116 | Exceptional 16.9% |
| Immigrants | Japan | 96.2 /100 | #117 | Exceptional 16.9% |
| Immigrants | Denmark | 96.2 /100 | #118 | Exceptional 16.9% |
| South Africans | 95.5 /100 | #119 | Exceptional 16.9% |
| Scottish | 95.0 /100 | #120 | Exceptional 16.9% |
| Immigrants | China | 94.9 /100 | #121 | Exceptional 16.9% |
| Immigrants | Western Europe | 94.8 /100 | #122 | Exceptional 16.9% |
| Portuguese | 94.7 /100 | #123 | Exceptional 16.9% |
| Turks | 94.5 /100 | #124 | Exceptional 16.9% |
| Scandinavians | 94.1 /100 | #125 | Exceptional 16.9% |
| Europeans | 93.4 /100 | #126 | Exceptional 17.0% |
| Immigrants | Costa Rica | 93.1 /100 | #127 | Exceptional 17.0% |
| Nicaraguans | 93.0 /100 | #128 | Exceptional 17.0% |
| Immigrants | Uruguay | 92.9 /100 | #129 | Exceptional 17.0% |
| Immigrants | Vietnam | 92.4 /100 | #130 | Exceptional 17.0% |
| Immigrants | Germany | 92.1 /100 | #131 | Exceptional 17.0% |