Indian (Asian) vs Immigrants from Nepal Ambulatory Disability
COMPARE
Indian (Asian)
Immigrants from Nepal
Ambulatory Disability
Ambulatory Disability Comparison
Indians (Asian)
Immigrants from Nepal
5.4%
AMBULATORY DISABILITY
100.0/ 100
METRIC RATING
19th/ 347
METRIC RANK
5.4%
AMBULATORY DISABILITY
100.0/ 100
METRIC RATING
26th/ 347
METRIC RANK
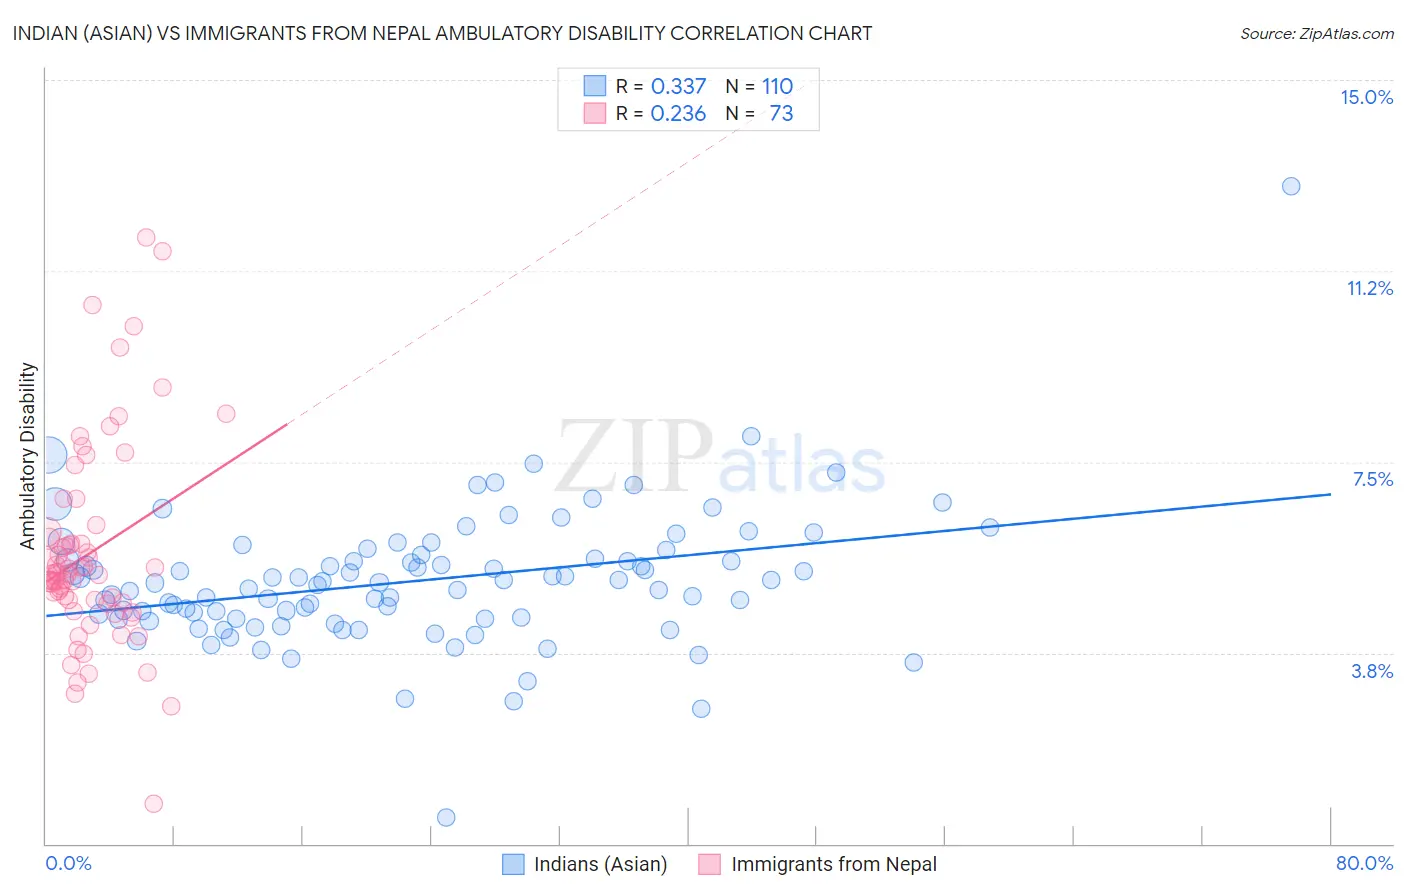
Indian (Asian) vs Immigrants from Nepal Ambulatory Disability Correlation Chart
The statistical analysis conducted on geographies consisting of 495,002,853 people shows a mild positive correlation between the proportion of Indians (Asian) and percentage of population with ambulatory disability in the United States with a correlation coefficient (R) of 0.337 and weighted average of 5.4%. Similarly, the statistical analysis conducted on geographies consisting of 186,771,176 people shows a weak positive correlation between the proportion of Immigrants from Nepal and percentage of population with ambulatory disability in the United States with a correlation coefficient (R) of 0.236 and weighted average of 5.4%, a difference of 0.64%.
Ambulatory Disability Correlation Summary
| Measurement | Indian (Asian) | Immigrants from Nepal |
| Minimum | 0.51% | 0.79% |
| Maximum | 12.9% | 11.9% |
| Range | 12.4% | 11.1% |
| Mean | 5.2% | 5.7% |
| Median | 5.1% | 5.3% |
| Interquartile 25% (IQ1) | 4.4% | 4.7% |
| Interquartile 75% (IQ3) | 5.6% | 6.1% |
| Interquartile Range (IQR) | 1.2% | 1.3% |
| Standard Deviation (Sample) | 1.3% | 2.0% |
| Standard Deviation (Population) | 1.3% | 2.0% |
Demographics Similar to Indians (Asian) and Immigrants from Nepal by Ambulatory Disability
In terms of ambulatory disability, the demographic groups most similar to Indians (Asian) are Ethiopian (5.4%, a difference of 0.020%), Immigrants from Kuwait (5.4%, a difference of 0.020%), Immigrants from Sri Lanka (5.4%, a difference of 0.10%), Immigrants from Ethiopia (5.4%, a difference of 0.11%), and Immigrants from Israel (5.4%, a difference of 0.39%). Similarly, the demographic groups most similar to Immigrants from Nepal are Zimbabwean (5.4%, a difference of 0.030%), Immigrants from Saudi Arabia (5.4%, a difference of 0.11%), Asian (5.4%, a difference of 0.16%), Tongan (5.4%, a difference of 0.20%), and Cambodian (5.4%, a difference of 0.22%).
| Demographics | Rating | Rank | Ambulatory Disability |
| Okinawans | 100.0 /100 | #12 | Exceptional 5.3% |
| Burmese | 100.0 /100 | #13 | Exceptional 5.3% |
| Immigrants | Eastern Asia | 100.0 /100 | #14 | Exceptional 5.3% |
| Immigrants | China | 100.0 /100 | #15 | Exceptional 5.3% |
| Immigrants | Hong Kong | 100.0 /100 | #16 | Exceptional 5.3% |
| Immigrants | Ethiopia | 100.0 /100 | #17 | Exceptional 5.4% |
| Immigrants | Sri Lanka | 100.0 /100 | #18 | Exceptional 5.4% |
| Indians (Asian) | 100.0 /100 | #19 | Exceptional 5.4% |
| Ethiopians | 100.0 /100 | #20 | Exceptional 5.4% |
| Immigrants | Kuwait | 100.0 /100 | #21 | Exceptional 5.4% |
| Immigrants | Israel | 100.0 /100 | #22 | Exceptional 5.4% |
| Tongans | 100.0 /100 | #23 | Exceptional 5.4% |
| Immigrants | Saudi Arabia | 100.0 /100 | #24 | Exceptional 5.4% |
| Zimbabweans | 100.0 /100 | #25 | Exceptional 5.4% |
| Immigrants | Nepal | 100.0 /100 | #26 | Exceptional 5.4% |
| Asians | 100.0 /100 | #27 | Exceptional 5.4% |
| Cambodians | 100.0 /100 | #28 | Exceptional 5.4% |
| Immigrants | Iran | 100.0 /100 | #29 | Exceptional 5.4% |
| Immigrants | Turkey | 100.0 /100 | #30 | Exceptional 5.4% |
| Immigrants | Venezuela | 100.0 /100 | #31 | Exceptional 5.4% |
| Immigrants | Australia | 100.0 /100 | #32 | Exceptional 5.5% |