Indian (Asian) vs Bangladeshi Disability Age 35 to 64
COMPARE
Indian (Asian)
Bangladeshi
Disability Age 35 to 64
Disability Age 35 to 64 Comparison
Indians (Asian)
Bangladeshis
8.9%
DISABILITY AGE 35 TO 64
100.0/ 100
METRIC RATING
12th/ 347
METRIC RANK
13.6%
DISABILITY AGE 35 TO 64
0.0/ 100
METRIC RATING
297th/ 347
METRIC RANK
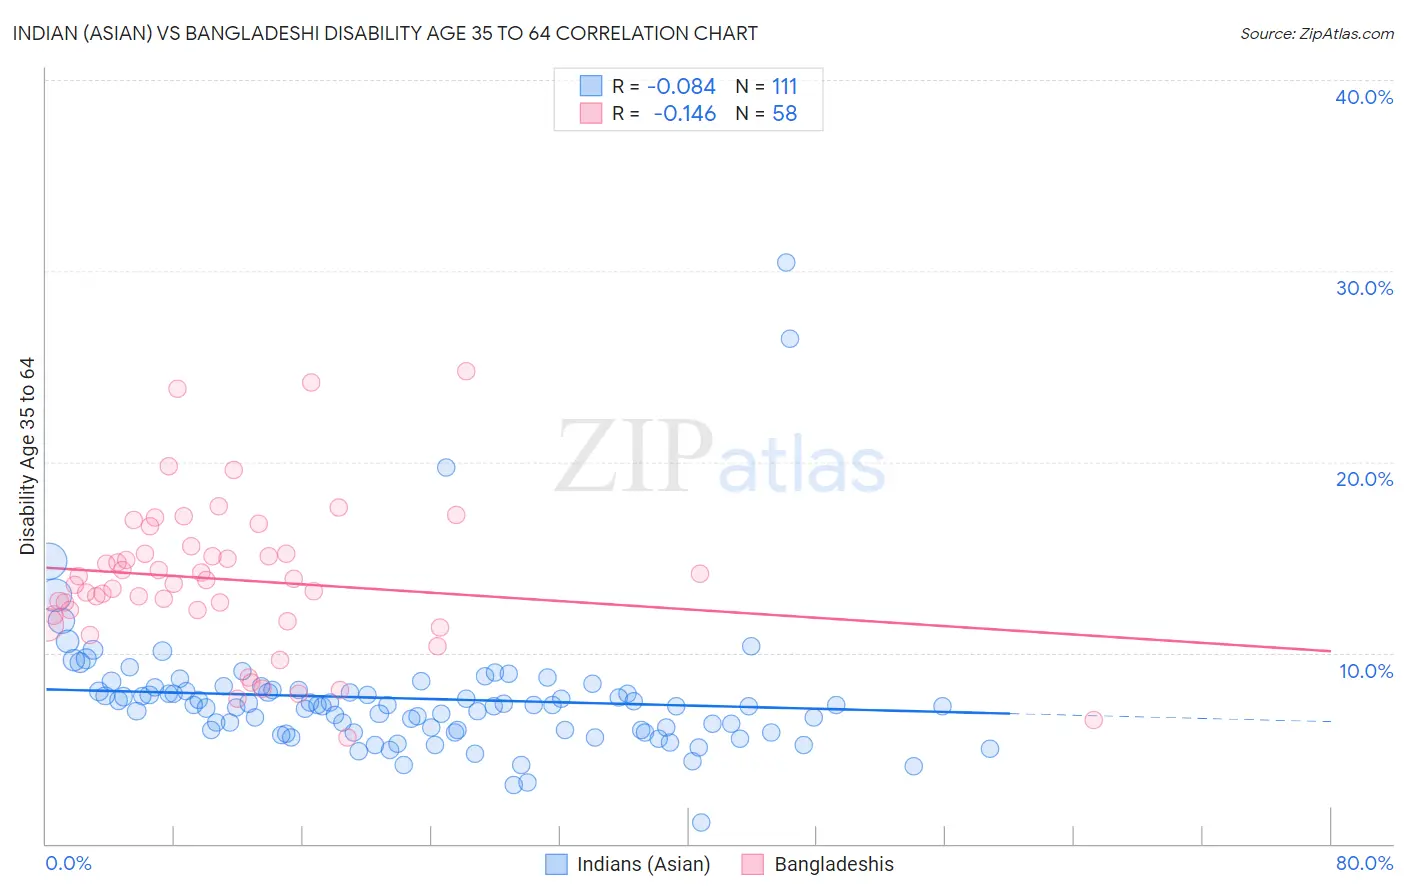
Indian (Asian) vs Bangladeshi Disability Age 35 to 64 Correlation Chart
The statistical analysis conducted on geographies consisting of 494,627,255 people shows a slight negative correlation between the proportion of Indians (Asian) and percentage of population with a disability between the ages 34 and 64 in the United States with a correlation coefficient (R) of -0.084 and weighted average of 8.9%. Similarly, the statistical analysis conducted on geographies consisting of 141,334,657 people shows a poor negative correlation between the proportion of Bangladeshis and percentage of population with a disability between the ages 34 and 64 in the United States with a correlation coefficient (R) of -0.146 and weighted average of 13.6%, a difference of 53.9%.
Disability Age 35 to 64 Correlation Summary
| Measurement | Indian (Asian) | Bangladeshi |
| Minimum | 1.1% | 5.6% |
| Maximum | 30.4% | 24.7% |
| Range | 29.3% | 19.2% |
| Mean | 7.6% | 13.8% |
| Median | 7.3% | 13.7% |
| Interquartile 25% (IQ1) | 5.9% | 12.0% |
| Interquartile 75% (IQ3) | 8.0% | 15.2% |
| Interquartile Range (IQR) | 2.1% | 3.2% |
| Standard Deviation (Sample) | 3.6% | 3.9% |
| Standard Deviation (Population) | 3.6% | 3.9% |
Similar Demographics by Disability Age 35 to 64
Demographics Similar to Indians (Asian) by Disability Age 35 to 64
In terms of disability age 35 to 64, the demographic groups most similar to Indians (Asian) are Immigrants from South Central Asia (8.9%, a difference of 0.090%), Immigrants from Singapore (8.9%, a difference of 0.69%), Immigrants from Eastern Asia (8.8%, a difference of 0.78%), Bolivian (8.9%, a difference of 0.98%), and Immigrants from Korea (9.0%, a difference of 1.3%).
| Demographics | Rating | Rank | Disability Age 35 to 64 |
| Immigrants | Iran | 100.0 /100 | #5 | Exceptional 8.5% |
| Thais | 100.0 /100 | #6 | Exceptional 8.6% |
| Immigrants | Israel | 100.0 /100 | #7 | Exceptional 8.6% |
| Iranians | 100.0 /100 | #8 | Exceptional 8.7% |
| Immigrants | China | 100.0 /100 | #9 | Exceptional 8.7% |
| Immigrants | Bolivia | 100.0 /100 | #10 | Exceptional 8.7% |
| Immigrants | Eastern Asia | 100.0 /100 | #11 | Exceptional 8.8% |
| Indians (Asian) | 100.0 /100 | #12 | Exceptional 8.9% |
| Immigrants | South Central Asia | 100.0 /100 | #13 | Exceptional 8.9% |
| Immigrants | Singapore | 100.0 /100 | #14 | Exceptional 8.9% |
| Bolivians | 100.0 /100 | #15 | Exceptional 8.9% |
| Immigrants | Korea | 100.0 /100 | #16 | Exceptional 9.0% |
| Burmese | 100.0 /100 | #17 | Exceptional 9.2% |
| Soviet Union | 100.0 /100 | #18 | Exceptional 9.2% |
| Immigrants | Venezuela | 100.0 /100 | #19 | Exceptional 9.3% |
Demographics Similar to Bangladeshis by Disability Age 35 to 64
In terms of disability age 35 to 64, the demographic groups most similar to Bangladeshis are Cheyenne (13.6%, a difference of 0.030%), Spanish American (13.7%, a difference of 0.23%), Delaware (13.7%, a difference of 0.31%), African (13.6%, a difference of 0.35%), and Yakama (13.6%, a difference of 0.57%).
| Demographics | Rating | Rank | Disability Age 35 to 64 |
| Immigrants | Liberia | 0.0 /100 | #290 | Tragic 13.2% |
| Immigrants | Congo | 0.0 /100 | #291 | Tragic 13.3% |
| Puget Sound Salish | 0.0 /100 | #292 | Tragic 13.3% |
| Ute | 0.0 /100 | #293 | Tragic 13.4% |
| Yaqui | 0.0 /100 | #294 | Tragic 13.5% |
| Yakama | 0.0 /100 | #295 | Tragic 13.6% |
| Africans | 0.0 /100 | #296 | Tragic 13.6% |
| Bangladeshis | 0.0 /100 | #297 | Tragic 13.6% |
| Cheyenne | 0.0 /100 | #298 | Tragic 13.6% |
| Spanish Americans | 0.0 /100 | #299 | Tragic 13.7% |
| Delaware | 0.0 /100 | #300 | Tragic 13.7% |
| French American Indians | 0.0 /100 | #301 | Tragic 13.7% |
| Aleuts | 0.0 /100 | #302 | Tragic 13.8% |
| Sioux | 0.0 /100 | #303 | Tragic 13.9% |
| Hopi | 0.0 /100 | #304 | Tragic 13.9% |