Spanish American vs Bangladeshi Male Disability
COMPARE
Spanish American
Bangladeshi
Male Disability
Male Disability Comparison
Spanish Americans
Bangladeshis
13.3%
MALE DISABILITY
0.0/ 100
METRIC RATING
306th/ 347
METRIC RANK
12.0%
MALE DISABILITY
0.5/ 100
METRIC RATING
250th/ 347
METRIC RANK
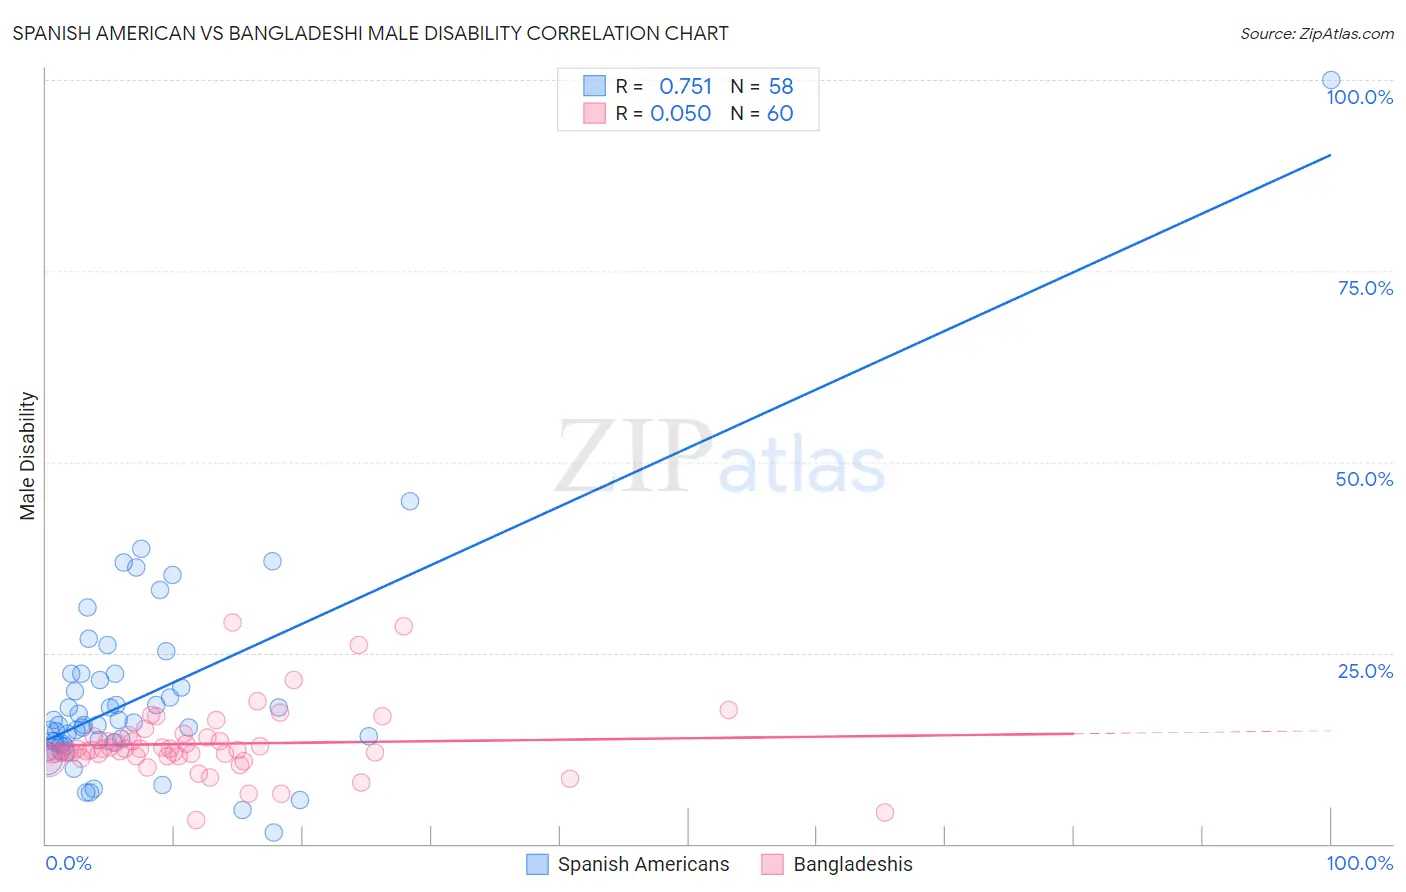
Spanish American vs Bangladeshi Male Disability Correlation Chart
The statistical analysis conducted on geographies consisting of 103,168,245 people shows a strong positive correlation between the proportion of Spanish Americans and percentage of males with a disability in the United States with a correlation coefficient (R) of 0.751 and weighted average of 13.3%. Similarly, the statistical analysis conducted on geographies consisting of 141,384,534 people shows a slight positive correlation between the proportion of Bangladeshis and percentage of males with a disability in the United States with a correlation coefficient (R) of 0.050 and weighted average of 12.0%, a difference of 10.6%.
Male Disability Correlation Summary
| Measurement | Spanish American | Bangladeshi |
| Minimum | 1.4% | 3.2% |
| Maximum | 100.0% | 29.0% |
| Range | 98.6% | 25.8% |
| Mean | 19.4% | 13.1% |
| Median | 15.6% | 12.3% |
| Interquartile 25% (IQ1) | 13.1% | 11.5% |
| Interquartile 75% (IQ3) | 22.2% | 14.0% |
| Interquartile Range (IQR) | 9.0% | 2.5% |
| Standard Deviation (Sample) | 14.1% | 4.6% |
| Standard Deviation (Population) | 14.0% | 4.6% |
Similar Demographics by Male Disability
Demographics Similar to Spanish Americans by Male Disability
In terms of male disability, the demographic groups most similar to Spanish Americans are French Canadian (13.3%, a difference of 0.20%), Arapaho (13.3%, a difference of 0.22%), French American Indian (13.4%, a difference of 0.38%), Black/African American (13.2%, a difference of 0.61%), and Blackfeet (13.4%, a difference of 0.80%).
| Demographics | Rating | Rank | Male Disability |
| Celtics | 0.0 /100 | #299 | Tragic 13.0% |
| Cheyenne | 0.0 /100 | #300 | Tragic 13.0% |
| French | 0.0 /100 | #301 | Tragic 13.0% |
| Crow | 0.0 /100 | #302 | Tragic 13.1% |
| Scotch-Irish | 0.0 /100 | #303 | Tragic 13.2% |
| Blacks/African Americans | 0.0 /100 | #304 | Tragic 13.2% |
| French Canadians | 0.0 /100 | #305 | Tragic 13.3% |
| Spanish Americans | 0.0 /100 | #306 | Tragic 13.3% |
| Arapaho | 0.0 /100 | #307 | Tragic 13.3% |
| French American Indians | 0.0 /100 | #308 | Tragic 13.4% |
| Blackfeet | 0.0 /100 | #309 | Tragic 13.4% |
| Immigrants | Azores | 0.0 /100 | #310 | Tragic 13.4% |
| Delaware | 0.0 /100 | #311 | Tragic 13.5% |
| Yakama | 0.0 /100 | #312 | Tragic 13.5% |
| Puget Sound Salish | 0.0 /100 | #313 | Tragic 13.5% |
Demographics Similar to Bangladeshis by Male Disability
In terms of male disability, the demographic groups most similar to Bangladeshis are German Russian (12.0%, a difference of 0.010%), Immigrants from Yemen (12.0%, a difference of 0.050%), Slovene (12.0%, a difference of 0.080%), Guamanian/Chamorro (12.0%, a difference of 0.080%), and British (12.1%, a difference of 0.27%).
| Demographics | Rating | Rank | Male Disability |
| Samoans | 1.1 /100 | #243 | Tragic 11.9% |
| Immigrants | Laos | 1.0 /100 | #244 | Tragic 11.9% |
| Immigrants | Liberia | 1.0 /100 | #245 | Tragic 11.9% |
| Danes | 0.9 /100 | #246 | Tragic 11.9% |
| Hungarians | 0.8 /100 | #247 | Tragic 12.0% |
| Poles | 0.7 /100 | #248 | Tragic 12.0% |
| Immigrants | Yemen | 0.5 /100 | #249 | Tragic 12.0% |
| Bangladeshis | 0.5 /100 | #250 | Tragic 12.0% |
| German Russians | 0.5 /100 | #251 | Tragic 12.0% |
| Slovenes | 0.5 /100 | #252 | Tragic 12.0% |
| Guamanians/Chamorros | 0.5 /100 | #253 | Tragic 12.0% |
| British | 0.4 /100 | #254 | Tragic 12.1% |
| Chinese | 0.4 /100 | #255 | Tragic 12.1% |
| Swiss | 0.3 /100 | #256 | Tragic 12.1% |
| Europeans | 0.3 /100 | #257 | Tragic 12.1% |