Immigrants vs Colville Disability
COMPARE
Immigrants
Colville
Disability
Disability Comparison
Immigrants
Colville
11.3%
DISABILITY
96.4/ 100
METRIC RATING
104th/ 347
METRIC RANK
15.8%
DISABILITY
0.0/ 100
METRIC RATING
344th/ 347
METRIC RANK
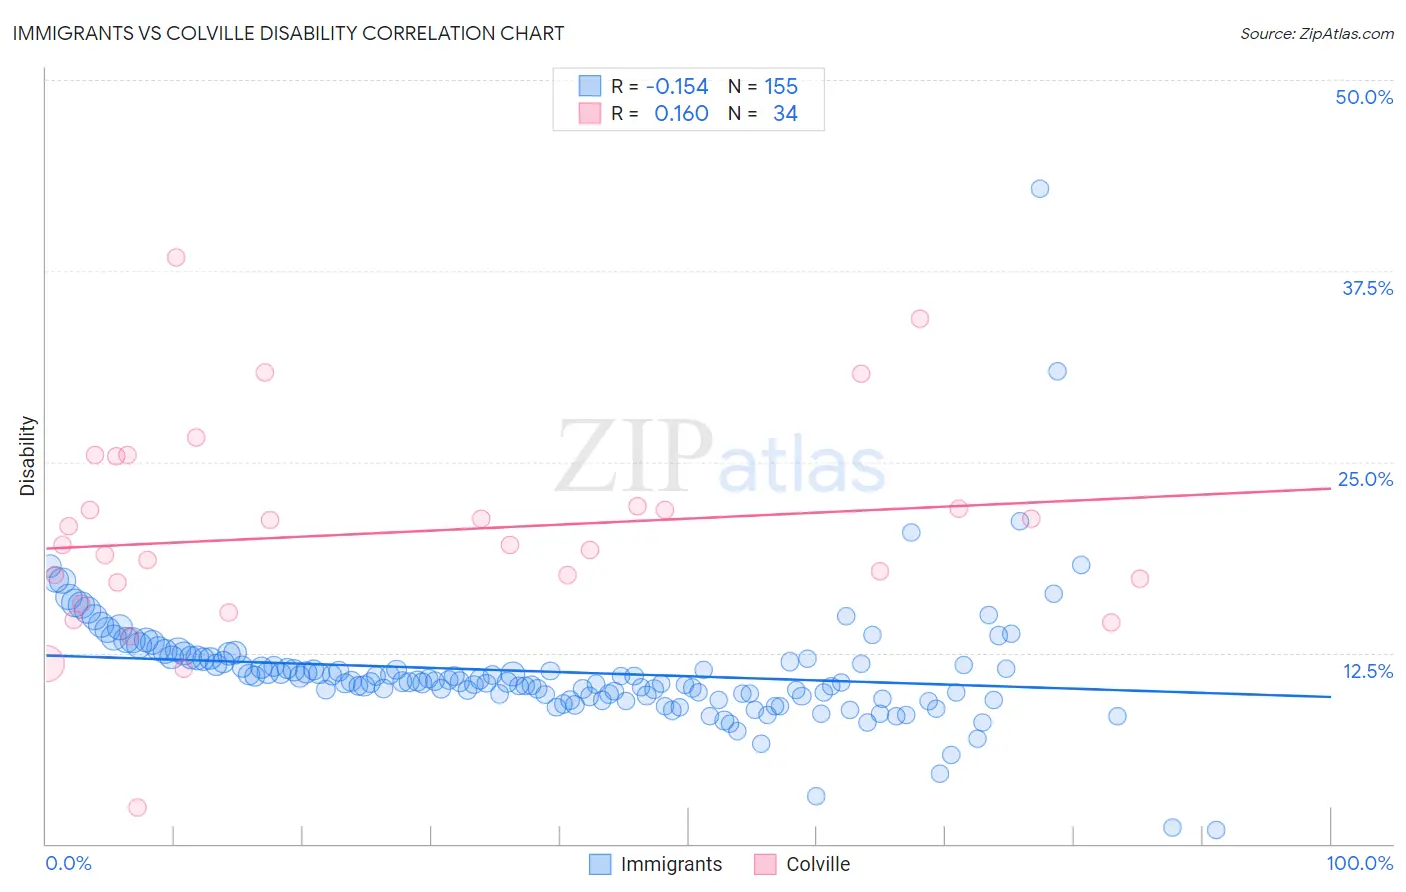
Immigrants vs Colville Disability Correlation Chart
The statistical analysis conducted on geographies consisting of 577,602,832 people shows a poor negative correlation between the proportion of Immigrants and percentage of population with a disability in the United States with a correlation coefficient (R) of -0.154 and weighted average of 11.3%. Similarly, the statistical analysis conducted on geographies consisting of 34,687,707 people shows a poor positive correlation between the proportion of Colville and percentage of population with a disability in the United States with a correlation coefficient (R) of 0.160 and weighted average of 15.8%, a difference of 40.1%.
Disability Correlation Summary
| Measurement | Immigrants | Colville |
| Minimum | 0.89% | 2.4% |
| Maximum | 42.9% | 38.4% |
| Range | 42.0% | 36.0% |
| Mean | 11.3% | 20.4% |
| Median | 10.6% | 19.6% |
| Interquartile 25% (IQ1) | 9.7% | 17.1% |
| Interquartile 75% (IQ3) | 12.1% | 22.1% |
| Interquartile Range (IQR) | 2.4% | 5.0% |
| Standard Deviation (Sample) | 4.1% | 6.9% |
| Standard Deviation (Population) | 4.1% | 6.8% |
Similar Demographics by Disability
Demographics Similar to Immigrants by Disability
In terms of disability, the demographic groups most similar to Immigrants are Immigrants from Uruguay (11.3%, a difference of 0.010%), Immigrants from Kazakhstan (11.3%, a difference of 0.010%), Immigrants from Eastern Europe (11.3%, a difference of 0.040%), Nicaraguan (11.3%, a difference of 0.060%), and Immigrants from Eastern Africa (11.3%, a difference of 0.080%).
| Demographics | Rating | Rank | Disability |
| Bhutanese | 97.4 /100 | #97 | Exceptional 11.2% |
| Uruguayans | 97.4 /100 | #98 | Exceptional 11.2% |
| Immigrants | Czechoslovakia | 97.4 /100 | #99 | Exceptional 11.2% |
| Immigrants | Greece | 96.9 /100 | #100 | Exceptional 11.3% |
| Immigrants | Nicaragua | 96.8 /100 | #101 | Exceptional 11.3% |
| Immigrants | Eastern Africa | 96.7 /100 | #102 | Exceptional 11.3% |
| Immigrants | Uruguay | 96.4 /100 | #103 | Exceptional 11.3% |
| Immigrants | Immigrants | 96.4 /100 | #104 | Exceptional 11.3% |
| Immigrants | Kazakhstan | 96.4 /100 | #105 | Exceptional 11.3% |
| Immigrants | Eastern Europe | 96.3 /100 | #106 | Exceptional 11.3% |
| Nicaraguans | 96.2 /100 | #107 | Exceptional 11.3% |
| Immigrants | Nigeria | 96.0 /100 | #108 | Exceptional 11.3% |
| Immigrants | Uganda | 95.7 /100 | #109 | Exceptional 11.3% |
| Immigrants | Denmark | 95.6 /100 | #110 | Exceptional 11.3% |
| Immigrants | South Eastern Asia | 95.4 /100 | #111 | Exceptional 11.3% |
Demographics Similar to Colville by Disability
In terms of disability, the demographic groups most similar to Colville are Creek (15.6%, a difference of 1.2%), Kiowa (15.6%, a difference of 1.2%), Lumbee (15.5%, a difference of 1.7%), Puerto Rican (16.1%, a difference of 2.0%), and Tsimshian (16.1%, a difference of 2.2%).
| Demographics | Rating | Rank | Disability |
| Cajuns | 0.0 /100 | #333 | Tragic 14.6% |
| Yuman | 0.0 /100 | #334 | Tragic 14.6% |
| Tohono O'odham | 0.0 /100 | #335 | Tragic 14.8% |
| Cherokee | 0.0 /100 | #336 | Tragic 14.8% |
| Seminole | 0.0 /100 | #337 | Tragic 14.9% |
| Dutch West Indians | 0.0 /100 | #338 | Tragic 14.9% |
| Chickasaw | 0.0 /100 | #339 | Tragic 15.2% |
| Choctaw | 0.0 /100 | #340 | Tragic 15.4% |
| Lumbee | 0.0 /100 | #341 | Tragic 15.5% |
| Kiowa | 0.0 /100 | #342 | Tragic 15.6% |
| Creek | 0.0 /100 | #343 | Tragic 15.6% |
| Colville | 0.0 /100 | #344 | Tragic 15.8% |
| Puerto Ricans | 0.0 /100 | #345 | Tragic 16.1% |
| Tsimshian | 0.0 /100 | #346 | Tragic 16.1% |
| Houma | 0.0 /100 | #347 | Tragic 17.1% |