Mexican vs Basque Vision Disability
COMPARE
Mexican
Basque
Vision Disability
Vision Disability Comparison
Mexicans
Basques
2.5%
VISION DISABILITY
0.0/ 100
METRIC RATING
298th/ 347
METRIC RANK
2.3%
VISION DISABILITY
3.5/ 100
METRIC RATING
223rd/ 347
METRIC RANK
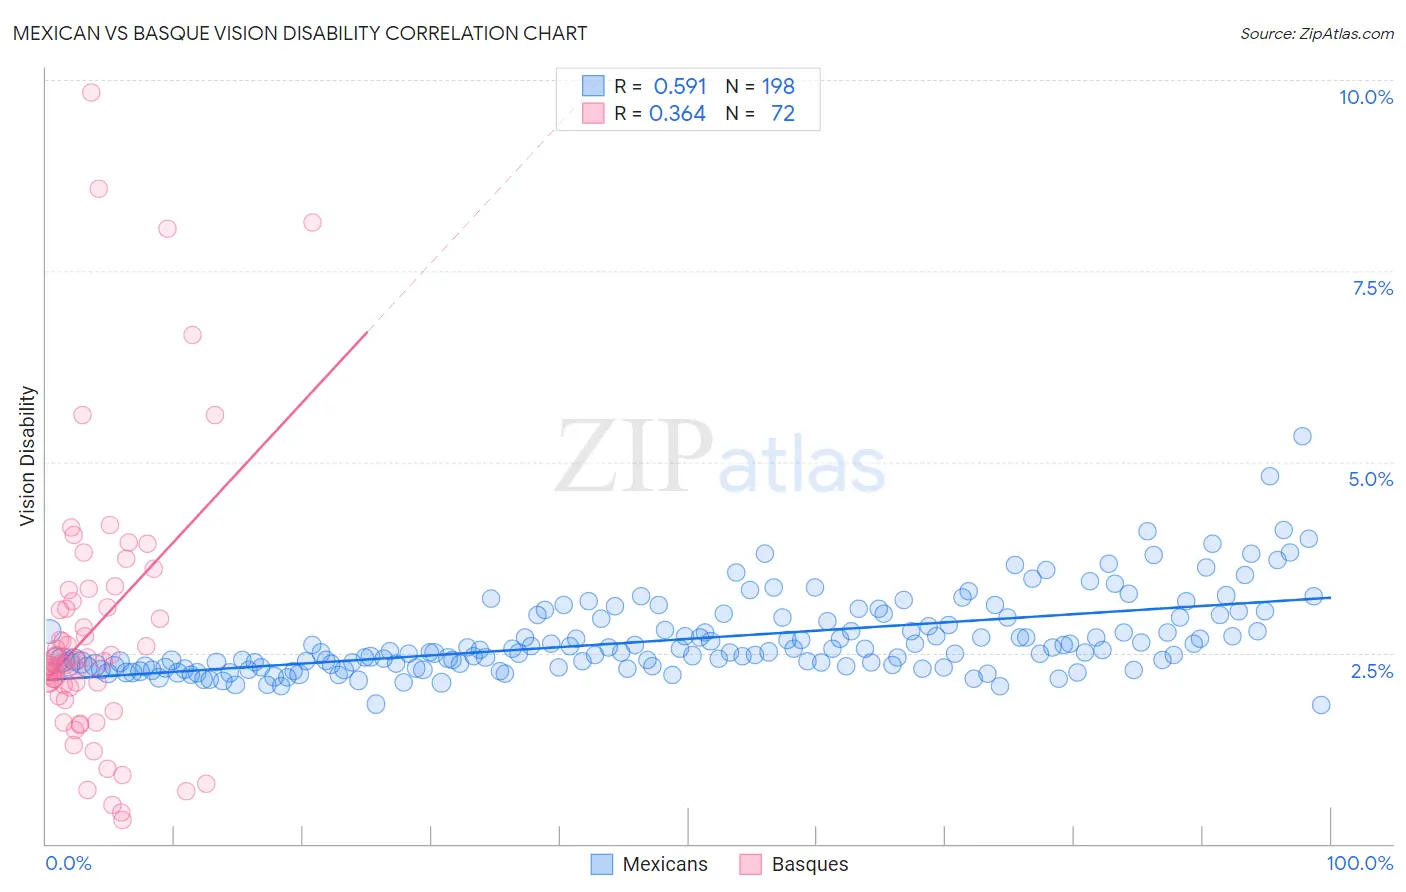
Mexican vs Basque Vision Disability Correlation Chart
The statistical analysis conducted on geographies consisting of 563,538,234 people shows a substantial positive correlation between the proportion of Mexicans and percentage of population with vision disability in the United States with a correlation coefficient (R) of 0.591 and weighted average of 2.5%. Similarly, the statistical analysis conducted on geographies consisting of 165,747,167 people shows a mild positive correlation between the proportion of Basques and percentage of population with vision disability in the United States with a correlation coefficient (R) of 0.364 and weighted average of 2.3%, a difference of 11.1%.
Vision Disability Correlation Summary
| Measurement | Mexican | Basque |
| Minimum | 1.8% | 0.32% |
| Maximum | 5.3% | 9.8% |
| Range | 3.5% | 9.5% |
| Mean | 2.7% | 2.8% |
| Median | 2.5% | 2.4% |
| Interquartile 25% (IQ1) | 2.3% | 2.0% |
| Interquartile 75% (IQ3) | 2.9% | 3.2% |
| Interquartile Range (IQR) | 0.62% | 1.3% |
| Standard Deviation (Sample) | 0.52% | 1.8% |
| Standard Deviation (Population) | 0.52% | 1.8% |
Similar Demographics by Vision Disability
Demographics Similar to Mexicans by Vision Disability
In terms of vision disability, the demographic groups most similar to Mexicans are Cree (2.5%, a difference of 0.040%), Immigrants from Dominica (2.5%, a difference of 0.14%), African (2.5%, a difference of 0.24%), Menominee (2.5%, a difference of 0.41%), and Immigrants from Mexico (2.5%, a difference of 0.82%).
| Demographics | Rating | Rank | Vision Disability |
| Immigrants | Honduras | 0.0 /100 | #291 | Tragic 2.5% |
| Crow | 0.0 /100 | #292 | Tragic 2.5% |
| Yaqui | 0.0 /100 | #293 | Tragic 2.5% |
| Ottawa | 0.0 /100 | #294 | Tragic 2.5% |
| Delaware | 0.0 /100 | #295 | Tragic 2.5% |
| Immigrants | Mexico | 0.0 /100 | #296 | Tragic 2.5% |
| Immigrants | Dominica | 0.0 /100 | #297 | Tragic 2.5% |
| Mexicans | 0.0 /100 | #298 | Tragic 2.5% |
| Cree | 0.0 /100 | #299 | Tragic 2.5% |
| Africans | 0.0 /100 | #300 | Tragic 2.5% |
| Menominee | 0.0 /100 | #301 | Tragic 2.5% |
| Spanish American Indians | 0.0 /100 | #302 | Tragic 2.6% |
| Immigrants | Cabo Verde | 0.0 /100 | #303 | Tragic 2.6% |
| Aleuts | 0.0 /100 | #304 | Tragic 2.6% |
| Hispanics or Latinos | 0.0 /100 | #305 | Tragic 2.6% |
Demographics Similar to Basques by Vision Disability
In terms of vision disability, the demographic groups most similar to Basques are Irish (2.3%, a difference of 0.020%), Immigrants from Western Africa (2.3%, a difference of 0.040%), Immigrants from Senegal (2.3%, a difference of 0.14%), French Canadian (2.3%, a difference of 0.16%), and Guamanian/Chamorro (2.3%, a difference of 0.18%).
| Demographics | Rating | Rank | Vision Disability |
| Immigrants | Trinidad and Tobago | 6.1 /100 | #216 | Tragic 2.3% |
| Barbadians | 5.1 /100 | #217 | Tragic 2.3% |
| Portuguese | 4.9 /100 | #218 | Tragic 2.3% |
| Ecuadorians | 4.6 /100 | #219 | Tragic 2.3% |
| Guamanians/Chamorros | 3.9 /100 | #220 | Tragic 2.3% |
| French Canadians | 3.9 /100 | #221 | Tragic 2.3% |
| Immigrants | Senegal | 3.8 /100 | #222 | Tragic 2.3% |
| Basques | 3.5 /100 | #223 | Tragic 2.3% |
| Irish | 3.4 /100 | #224 | Tragic 2.3% |
| Immigrants | Western Africa | 3.4 /100 | #225 | Tragic 2.3% |
| Immigrants | Germany | 3.0 /100 | #226 | Tragic 2.3% |
| Hawaiians | 2.9 /100 | #227 | Tragic 2.3% |
| Hmong | 2.5 /100 | #228 | Tragic 2.3% |
| Welsh | 2.3 /100 | #229 | Tragic 2.3% |
| Nicaraguans | 2.2 /100 | #230 | Tragic 2.3% |