Immigrants from Ethiopia vs Basque Vision Disability
COMPARE
Immigrants from Ethiopia
Basque
Vision Disability
Vision Disability Comparison
Immigrants from Ethiopia
Basques
2.0%
VISION DISABILITY
99.7/ 100
METRIC RATING
42nd/ 347
METRIC RANK
2.3%
VISION DISABILITY
3.5/ 100
METRIC RATING
223rd/ 347
METRIC RANK
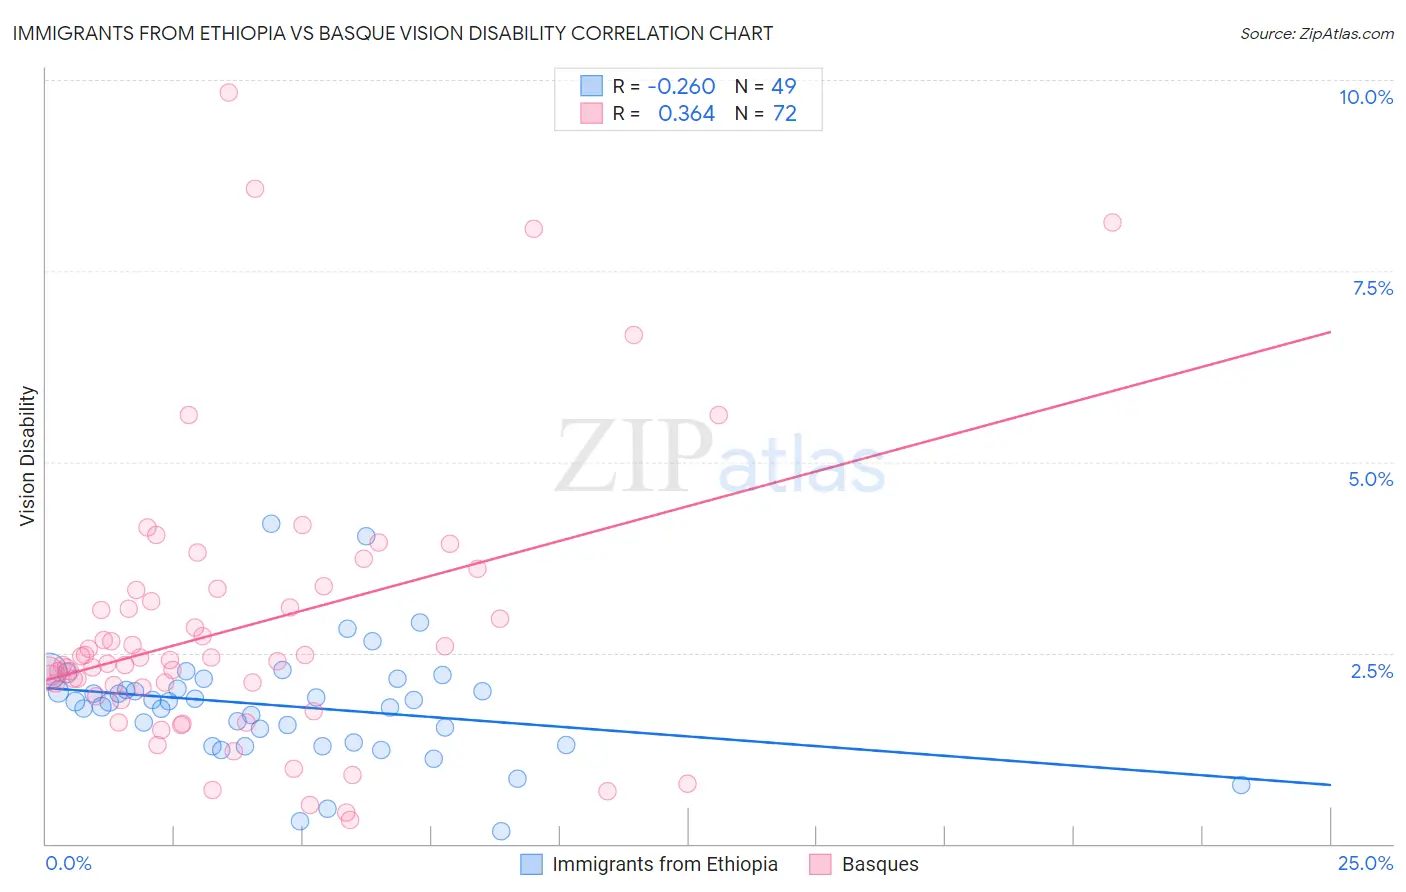
Immigrants from Ethiopia vs Basque Vision Disability Correlation Chart
The statistical analysis conducted on geographies consisting of 211,444,224 people shows a weak negative correlation between the proportion of Immigrants from Ethiopia and percentage of population with vision disability in the United States with a correlation coefficient (R) of -0.260 and weighted average of 2.0%. Similarly, the statistical analysis conducted on geographies consisting of 165,747,167 people shows a mild positive correlation between the proportion of Basques and percentage of population with vision disability in the United States with a correlation coefficient (R) of 0.364 and weighted average of 2.3%, a difference of 15.7%.
Vision Disability Correlation Summary
| Measurement | Immigrants from Ethiopia | Basque |
| Minimum | 0.17% | 0.32% |
| Maximum | 4.2% | 9.8% |
| Range | 4.0% | 9.5% |
| Mean | 1.8% | 2.8% |
| Median | 1.9% | 2.4% |
| Interquartile 25% (IQ1) | 1.3% | 2.0% |
| Interquartile 75% (IQ3) | 2.1% | 3.2% |
| Interquartile Range (IQR) | 0.79% | 1.3% |
| Standard Deviation (Sample) | 0.74% | 1.8% |
| Standard Deviation (Population) | 0.74% | 1.8% |
Similar Demographics by Vision Disability
Demographics Similar to Immigrants from Ethiopia by Vision Disability
In terms of vision disability, the demographic groups most similar to Immigrants from Ethiopia are Eastern European (2.0%, a difference of 0.060%), Immigrants from Indonesia (2.0%, a difference of 0.090%), Ethiopian (2.0%, a difference of 0.11%), Immigrants from Sweden (2.0%, a difference of 0.15%), and Cypriot (2.0%, a difference of 0.16%).
| Demographics | Rating | Rank | Vision Disability |
| Immigrants | Australia | 99.8 /100 | #35 | Exceptional 1.9% |
| Cambodians | 99.8 /100 | #36 | Exceptional 2.0% |
| Bhutanese | 99.8 /100 | #37 | Exceptional 2.0% |
| Immigrants | Kuwait | 99.8 /100 | #38 | Exceptional 2.0% |
| Zimbabweans | 99.7 /100 | #39 | Exceptional 2.0% |
| Immigrants | Ireland | 99.7 /100 | #40 | Exceptional 2.0% |
| Cypriots | 99.7 /100 | #41 | Exceptional 2.0% |
| Immigrants | Ethiopia | 99.7 /100 | #42 | Exceptional 2.0% |
| Eastern Europeans | 99.7 /100 | #43 | Exceptional 2.0% |
| Immigrants | Indonesia | 99.7 /100 | #44 | Exceptional 2.0% |
| Ethiopians | 99.7 /100 | #45 | Exceptional 2.0% |
| Immigrants | Sweden | 99.7 /100 | #46 | Exceptional 2.0% |
| Immigrants | Bulgaria | 99.7 /100 | #47 | Exceptional 2.0% |
| Israelis | 99.6 /100 | #48 | Exceptional 2.0% |
| Latvians | 99.5 /100 | #49 | Exceptional 2.0% |
Demographics Similar to Basques by Vision Disability
In terms of vision disability, the demographic groups most similar to Basques are Irish (2.3%, a difference of 0.020%), Immigrants from Western Africa (2.3%, a difference of 0.040%), Immigrants from Senegal (2.3%, a difference of 0.14%), French Canadian (2.3%, a difference of 0.16%), and Guamanian/Chamorro (2.3%, a difference of 0.18%).
| Demographics | Rating | Rank | Vision Disability |
| Immigrants | Trinidad and Tobago | 6.1 /100 | #216 | Tragic 2.3% |
| Barbadians | 5.1 /100 | #217 | Tragic 2.3% |
| Portuguese | 4.9 /100 | #218 | Tragic 2.3% |
| Ecuadorians | 4.6 /100 | #219 | Tragic 2.3% |
| Guamanians/Chamorros | 3.9 /100 | #220 | Tragic 2.3% |
| French Canadians | 3.9 /100 | #221 | Tragic 2.3% |
| Immigrants | Senegal | 3.8 /100 | #222 | Tragic 2.3% |
| Basques | 3.5 /100 | #223 | Tragic 2.3% |
| Irish | 3.4 /100 | #224 | Tragic 2.3% |
| Immigrants | Western Africa | 3.4 /100 | #225 | Tragic 2.3% |
| Immigrants | Germany | 3.0 /100 | #226 | Tragic 2.3% |
| Hawaiians | 2.9 /100 | #227 | Tragic 2.3% |
| Hmong | 2.5 /100 | #228 | Tragic 2.3% |
| Welsh | 2.3 /100 | #229 | Tragic 2.3% |
| Nicaraguans | 2.2 /100 | #230 | Tragic 2.3% |