Immigrants from India vs Basque Vision Disability
COMPARE
Immigrants from India
Basque
Vision Disability
Vision Disability Comparison
Immigrants from India
Basques
1.7%
VISION DISABILITY
100.0/ 100
METRIC RATING
1st/ 347
METRIC RANK
2.3%
VISION DISABILITY
3.5/ 100
METRIC RATING
223rd/ 347
METRIC RANK
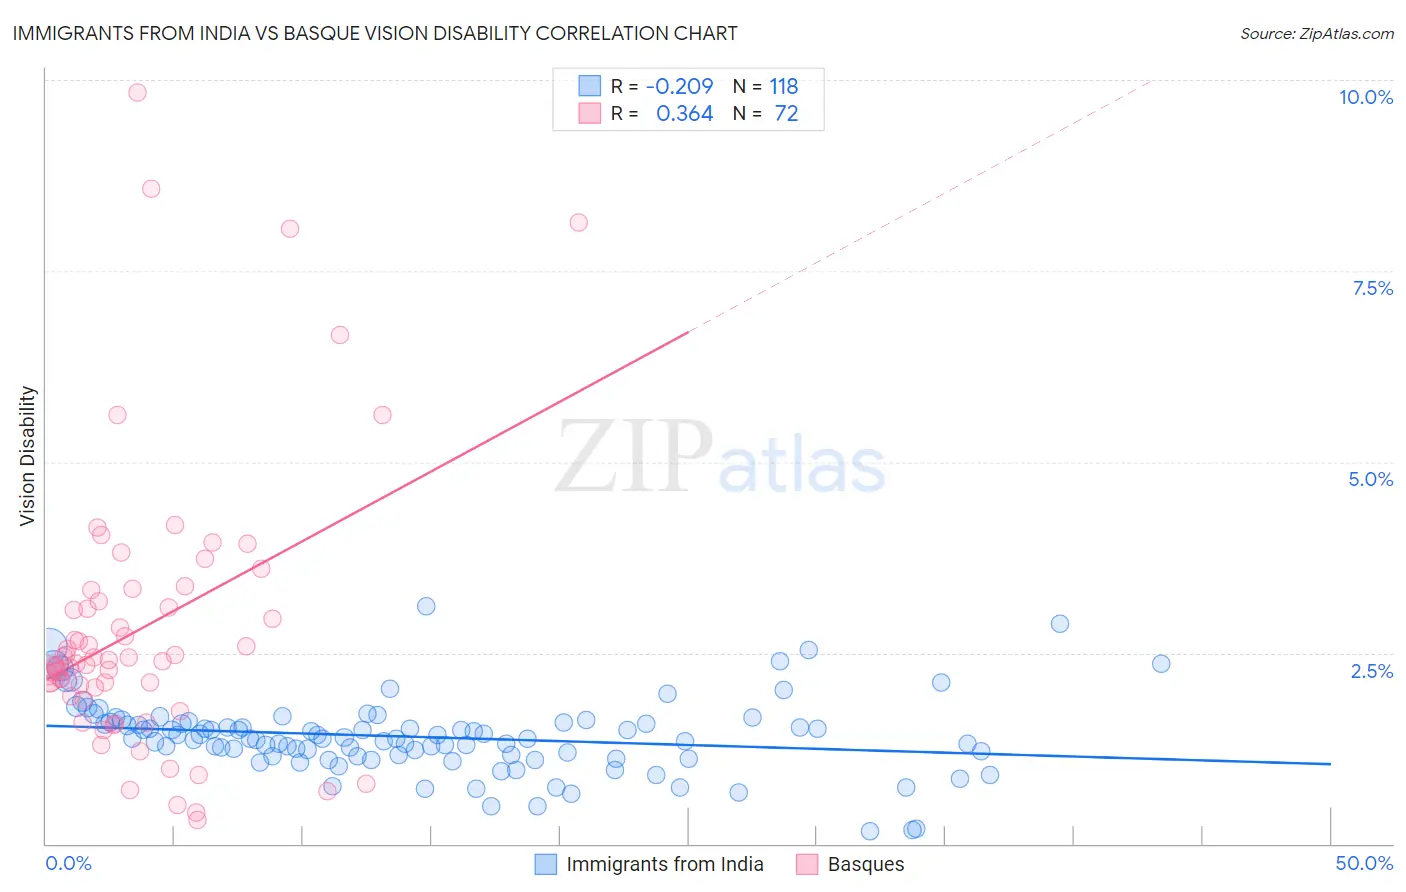
Immigrants from India vs Basque Vision Disability Correlation Chart
The statistical analysis conducted on geographies consisting of 433,750,609 people shows a weak negative correlation between the proportion of Immigrants from India and percentage of population with vision disability in the United States with a correlation coefficient (R) of -0.209 and weighted average of 1.7%. Similarly, the statistical analysis conducted on geographies consisting of 165,747,167 people shows a mild positive correlation between the proportion of Basques and percentage of population with vision disability in the United States with a correlation coefficient (R) of 0.364 and weighted average of 2.3%, a difference of 35.3%.
Vision Disability Correlation Summary
| Measurement | Immigrants from India | Basque |
| Minimum | 0.17% | 0.32% |
| Maximum | 3.1% | 9.8% |
| Range | 2.9% | 9.5% |
| Mean | 1.4% | 2.8% |
| Median | 1.4% | 2.4% |
| Interquartile 25% (IQ1) | 1.2% | 2.0% |
| Interquartile 75% (IQ3) | 1.6% | 3.2% |
| Interquartile Range (IQR) | 0.43% | 1.3% |
| Standard Deviation (Sample) | 0.49% | 1.8% |
| Standard Deviation (Population) | 0.49% | 1.8% |
Similar Demographics by Vision Disability
Demographics Similar to Immigrants from India by Vision Disability
In terms of vision disability, the demographic groups most similar to Immigrants from India are Filipino (1.7%, a difference of 0.050%), Immigrants from Taiwan (1.7%, a difference of 0.71%), Thai (1.7%, a difference of 3.4%), Okinawan (1.8%, a difference of 5.3%), and Immigrants from Iran (1.8%, a difference of 6.0%).
| Demographics | Rating | Rank | Vision Disability |
| Immigrants | India | 100.0 /100 | #1 | Exceptional 1.7% |
| Filipinos | 100.0 /100 | #2 | Exceptional 1.7% |
| Immigrants | Taiwan | 100.0 /100 | #3 | Exceptional 1.7% |
| Thais | 100.0 /100 | #4 | Exceptional 1.7% |
| Okinawans | 100.0 /100 | #5 | Exceptional 1.8% |
| Immigrants | Iran | 100.0 /100 | #6 | Exceptional 1.8% |
| Immigrants | South Central Asia | 100.0 /100 | #7 | Exceptional 1.8% |
| Iranians | 100.0 /100 | #8 | Exceptional 1.8% |
| Immigrants | Singapore | 100.0 /100 | #9 | Exceptional 1.8% |
| Immigrants | Hong Kong | 100.0 /100 | #10 | Exceptional 1.8% |
| Immigrants | Israel | 100.0 /100 | #11 | Exceptional 1.8% |
| Immigrants | Korea | 100.0 /100 | #12 | Exceptional 1.8% |
| Immigrants | Eastern Asia | 100.0 /100 | #13 | Exceptional 1.8% |
| Immigrants | China | 100.0 /100 | #14 | Exceptional 1.8% |
| Immigrants | Bolivia | 100.0 /100 | #15 | Exceptional 1.8% |
Demographics Similar to Basques by Vision Disability
In terms of vision disability, the demographic groups most similar to Basques are Irish (2.3%, a difference of 0.020%), Immigrants from Western Africa (2.3%, a difference of 0.040%), Immigrants from Senegal (2.3%, a difference of 0.14%), French Canadian (2.3%, a difference of 0.16%), and Guamanian/Chamorro (2.3%, a difference of 0.18%).
| Demographics | Rating | Rank | Vision Disability |
| Immigrants | Trinidad and Tobago | 6.1 /100 | #216 | Tragic 2.3% |
| Barbadians | 5.1 /100 | #217 | Tragic 2.3% |
| Portuguese | 4.9 /100 | #218 | Tragic 2.3% |
| Ecuadorians | 4.6 /100 | #219 | Tragic 2.3% |
| Guamanians/Chamorros | 3.9 /100 | #220 | Tragic 2.3% |
| French Canadians | 3.9 /100 | #221 | Tragic 2.3% |
| Immigrants | Senegal | 3.8 /100 | #222 | Tragic 2.3% |
| Basques | 3.5 /100 | #223 | Tragic 2.3% |
| Irish | 3.4 /100 | #224 | Tragic 2.3% |
| Immigrants | Western Africa | 3.4 /100 | #225 | Tragic 2.3% |
| Immigrants | Germany | 3.0 /100 | #226 | Tragic 2.3% |
| Hawaiians | 2.9 /100 | #227 | Tragic 2.3% |
| Hmong | 2.5 /100 | #228 | Tragic 2.3% |
| Welsh | 2.3 /100 | #229 | Tragic 2.3% |
| Nicaraguans | 2.2 /100 | #230 | Tragic 2.3% |