Dominican vs Ecuadorian Female Disability
COMPARE
Dominican
Ecuadorian
Female Disability
Female Disability Comparison
Dominicans
Ecuadorians
13.5%
FEMALE DISABILITY
0.0/ 100
METRIC RATING
305th/ 347
METRIC RANK
11.9%
FEMALE DISABILITY
93.4/ 100
METRIC RATING
138th/ 347
METRIC RANK
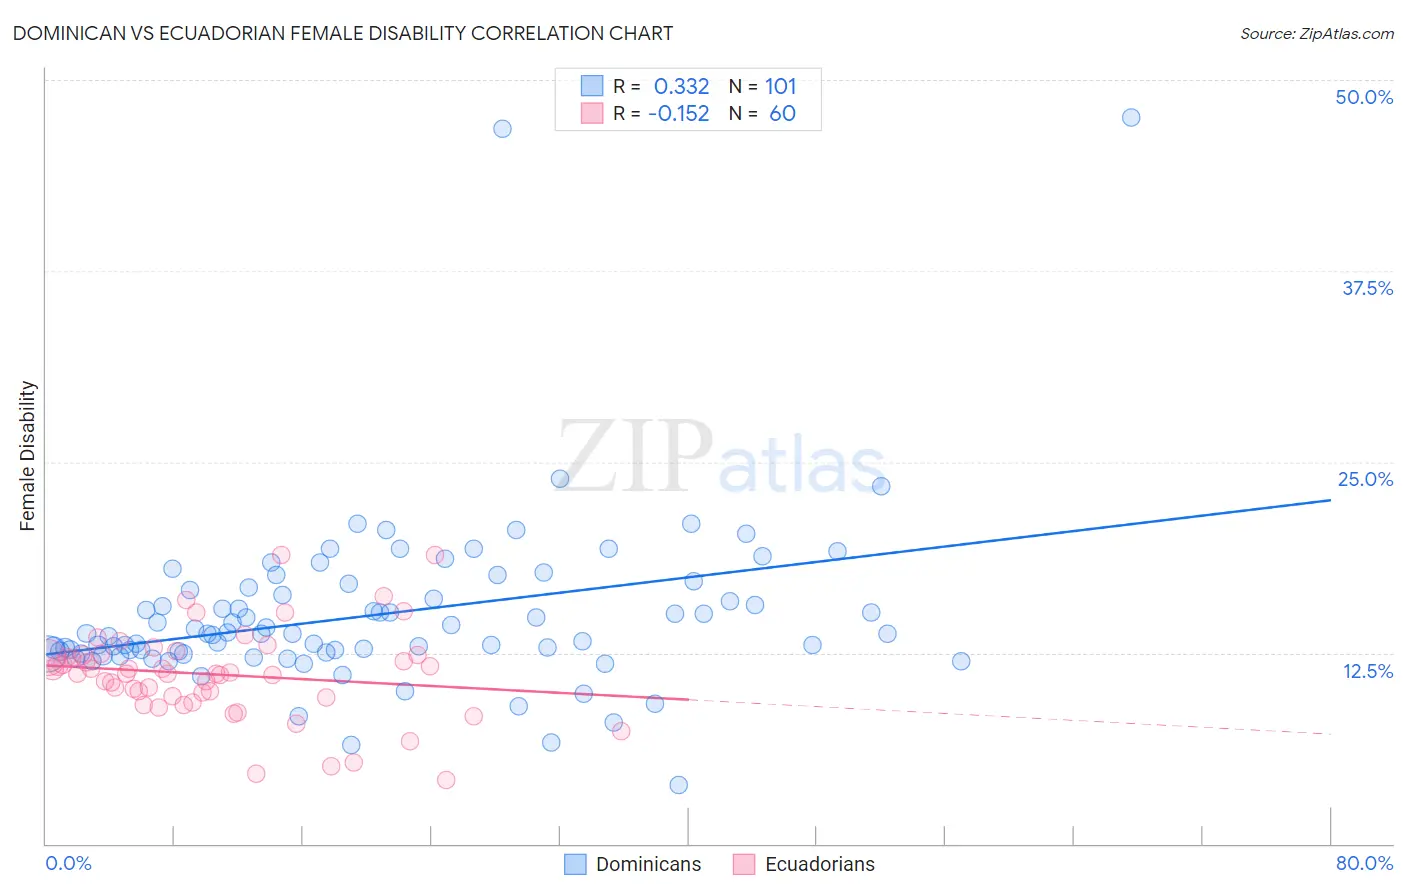
Dominican vs Ecuadorian Female Disability Correlation Chart
The statistical analysis conducted on geographies consisting of 355,036,976 people shows a mild positive correlation between the proportion of Dominicans and percentage of females with a disability in the United States with a correlation coefficient (R) of 0.332 and weighted average of 13.5%. Similarly, the statistical analysis conducted on geographies consisting of 317,804,285 people shows a poor negative correlation between the proportion of Ecuadorians and percentage of females with a disability in the United States with a correlation coefficient (R) of -0.152 and weighted average of 11.9%, a difference of 13.5%.
Female Disability Correlation Summary
| Measurement | Dominican | Ecuadorian |
| Minimum | 3.9% | 4.2% |
| Maximum | 47.5% | 18.9% |
| Range | 43.7% | 14.7% |
| Mean | 15.0% | 11.1% |
| Median | 13.8% | 11.2% |
| Interquartile 25% (IQ1) | 12.5% | 9.6% |
| Interquartile 75% (IQ3) | 16.7% | 12.3% |
| Interquartile Range (IQR) | 4.2% | 2.7% |
| Standard Deviation (Sample) | 5.8% | 2.9% |
| Standard Deviation (Population) | 5.7% | 2.9% |
Similar Demographics by Female Disability
Demographics Similar to Dominicans by Female Disability
In terms of female disability, the demographic groups most similar to Dominicans are Immigrants from Micronesia (13.5%, a difference of 0.31%), Immigrants from Portugal (13.5%, a difference of 0.34%), Scotch-Irish (13.4%, a difference of 0.35%), African (13.4%, a difference of 0.48%), and French Canadian (13.6%, a difference of 0.63%).
| Demographics | Rating | Rank | Female Disability |
| Immigrants | Nonimmigrants | 0.0 /100 | #298 | Tragic 13.4% |
| Immigrants | Dominican Republic | 0.0 /100 | #299 | Tragic 13.4% |
| Pennsylvania Germans | 0.0 /100 | #300 | Tragic 13.4% |
| Africans | 0.0 /100 | #301 | Tragic 13.4% |
| Scotch-Irish | 0.0 /100 | #302 | Tragic 13.4% |
| Immigrants | Portugal | 0.0 /100 | #303 | Tragic 13.5% |
| Immigrants | Micronesia | 0.0 /100 | #304 | Tragic 13.5% |
| Dominicans | 0.0 /100 | #305 | Tragic 13.5% |
| French Canadians | 0.0 /100 | #306 | Tragic 13.6% |
| Central American Indians | 0.0 /100 | #307 | Tragic 13.6% |
| Cree | 0.0 /100 | #308 | Tragic 13.7% |
| French American Indians | 0.0 /100 | #309 | Tragic 13.7% |
| Apache | 0.0 /100 | #310 | Tragic 13.7% |
| Hopi | 0.0 /100 | #311 | Tragic 13.7% |
| Delaware | 0.0 /100 | #312 | Tragic 13.8% |
Demographics Similar to Ecuadorians by Female Disability
In terms of female disability, the demographic groups most similar to Ecuadorians are Immigrants from Norway (11.9%, a difference of 0.060%), Immigrants from Hungary (11.9%, a difference of 0.090%), Ugandan (11.9%, a difference of 0.10%), Central American (11.9%, a difference of 0.12%), and Kenyan (11.9%, a difference of 0.19%).
| Demographics | Rating | Rank | Female Disability |
| Arabs | 95.1 /100 | #131 | Exceptional 11.9% |
| Immigrants | Syria | 94.6 /100 | #132 | Exceptional 11.9% |
| Kenyans | 94.5 /100 | #133 | Exceptional 11.9% |
| Immigrants | Nicaragua | 94.5 /100 | #134 | Exceptional 11.9% |
| Central Americans | 94.2 /100 | #135 | Exceptional 11.9% |
| Ugandans | 94.0 /100 | #136 | Exceptional 11.9% |
| Immigrants | Norway | 93.8 /100 | #137 | Exceptional 11.9% |
| Ecuadorians | 93.4 /100 | #138 | Exceptional 11.9% |
| Immigrants | Hungary | 92.8 /100 | #139 | Exceptional 11.9% |
| Romanians | 91.6 /100 | #140 | Exceptional 11.9% |
| Immigrants | Ecuador | 91.5 /100 | #141 | Exceptional 11.9% |
| Immigrants | Africa | 90.0 /100 | #142 | Excellent 11.9% |
| Immigrants | Sudan | 89.6 /100 | #143 | Excellent 11.9% |
| Immigrants | Austria | 87.9 /100 | #144 | Excellent 12.0% |
| Estonians | 87.8 /100 | #145 | Excellent 12.0% |