Immigrants from Singapore vs Ecuadorian Female Disability
COMPARE
Immigrants from Singapore
Ecuadorian
Female Disability
Female Disability Comparison
Immigrants from Singapore
Ecuadorians
10.4%
FEMALE DISABILITY
100.0/ 100
METRIC RATING
7th/ 347
METRIC RANK
11.9%
FEMALE DISABILITY
93.4/ 100
METRIC RATING
138th/ 347
METRIC RANK
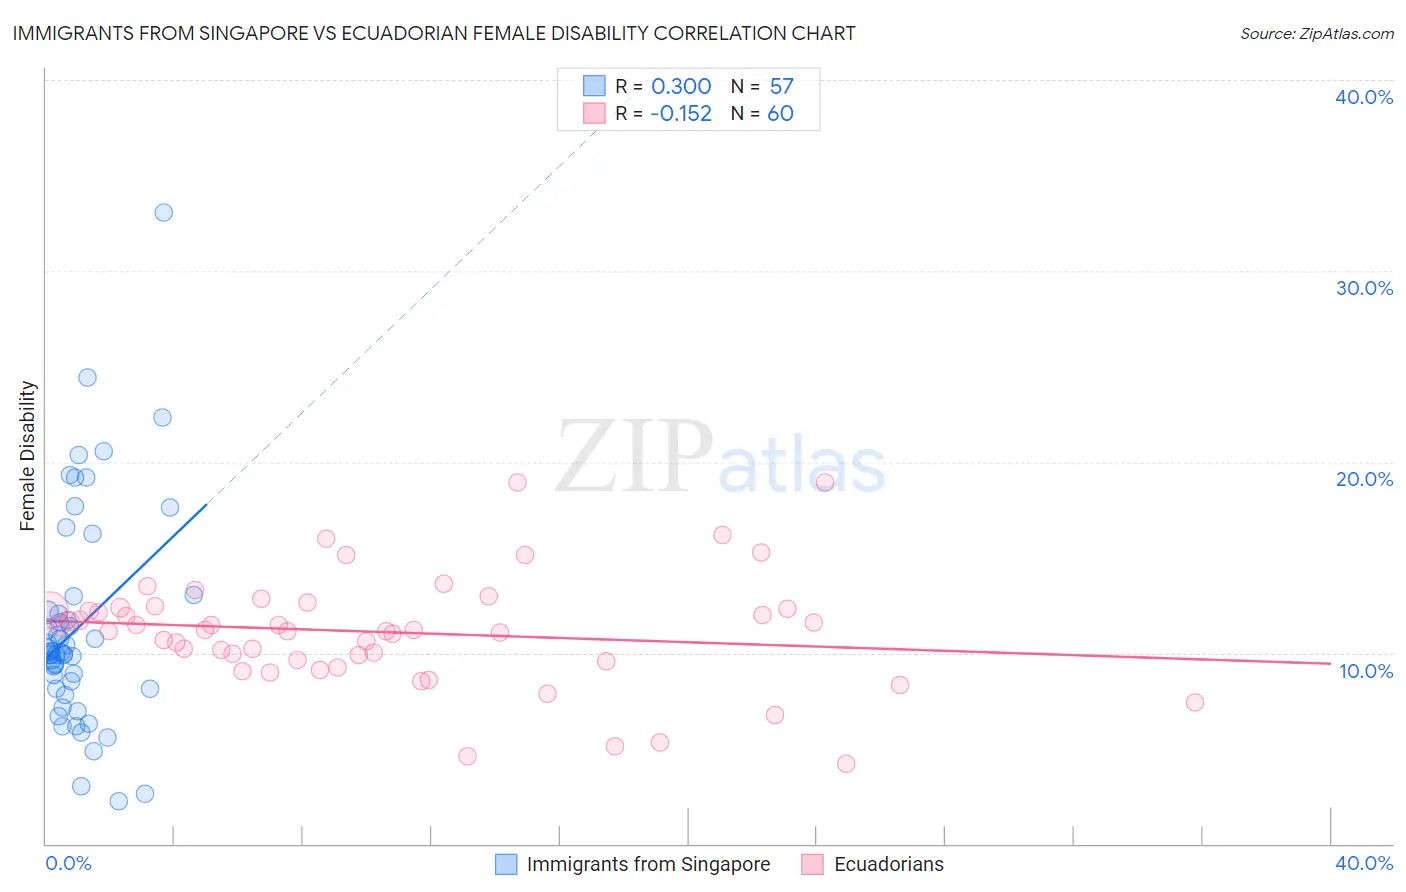
Immigrants from Singapore vs Ecuadorian Female Disability Correlation Chart
The statistical analysis conducted on geographies consisting of 137,521,534 people shows a weak positive correlation between the proportion of Immigrants from Singapore and percentage of females with a disability in the United States with a correlation coefficient (R) of 0.300 and weighted average of 10.4%. Similarly, the statistical analysis conducted on geographies consisting of 317,804,285 people shows a poor negative correlation between the proportion of Ecuadorians and percentage of females with a disability in the United States with a correlation coefficient (R) of -0.152 and weighted average of 11.9%, a difference of 14.0%.
Female Disability Correlation Summary
| Measurement | Immigrants from Singapore | Ecuadorian |
| Minimum | 2.2% | 4.2% |
| Maximum | 33.0% | 18.9% |
| Range | 30.8% | 14.7% |
| Mean | 11.4% | 11.1% |
| Median | 10.0% | 11.2% |
| Interquartile 25% (IQ1) | 8.1% | 9.6% |
| Interquartile 75% (IQ3) | 12.6% | 12.3% |
| Interquartile Range (IQR) | 4.4% | 2.7% |
| Standard Deviation (Sample) | 5.7% | 2.9% |
| Standard Deviation (Population) | 5.6% | 2.9% |
Similar Demographics by Female Disability
Demographics Similar to Immigrants from Singapore by Female Disability
In terms of female disability, the demographic groups most similar to Immigrants from Singapore are Immigrants from South Central Asia (10.5%, a difference of 0.22%), Bolivian (10.4%, a difference of 0.78%), Iranian (10.6%, a difference of 1.1%), Immigrants from Bolivia (10.3%, a difference of 1.7%), and Immigrants from Hong Kong (10.6%, a difference of 1.8%).
| Demographics | Rating | Rank | Female Disability |
| Immigrants | India | 100.0 /100 | #1 | Exceptional 10.0% |
| Filipinos | 100.0 /100 | #2 | Exceptional 10.1% |
| Immigrants | Taiwan | 100.0 /100 | #3 | Exceptional 10.1% |
| Thais | 100.0 /100 | #4 | Exceptional 10.2% |
| Immigrants | Bolivia | 100.0 /100 | #5 | Exceptional 10.3% |
| Bolivians | 100.0 /100 | #6 | Exceptional 10.4% |
| Immigrants | Singapore | 100.0 /100 | #7 | Exceptional 10.4% |
| Immigrants | South Central Asia | 100.0 /100 | #8 | Exceptional 10.5% |
| Iranians | 100.0 /100 | #9 | Exceptional 10.6% |
| Immigrants | Hong Kong | 100.0 /100 | #10 | Exceptional 10.6% |
| Immigrants | Korea | 100.0 /100 | #11 | Exceptional 10.6% |
| Immigrants | Israel | 100.0 /100 | #12 | Exceptional 10.7% |
| Immigrants | Eastern Asia | 100.0 /100 | #13 | Exceptional 10.7% |
| Immigrants | China | 100.0 /100 | #14 | Exceptional 10.7% |
| Burmese | 100.0 /100 | #15 | Exceptional 10.7% |
Demographics Similar to Ecuadorians by Female Disability
In terms of female disability, the demographic groups most similar to Ecuadorians are Immigrants from Norway (11.9%, a difference of 0.060%), Immigrants from Hungary (11.9%, a difference of 0.090%), Ugandan (11.9%, a difference of 0.10%), Central American (11.9%, a difference of 0.12%), and Kenyan (11.9%, a difference of 0.19%).
| Demographics | Rating | Rank | Female Disability |
| Arabs | 95.1 /100 | #131 | Exceptional 11.9% |
| Immigrants | Syria | 94.6 /100 | #132 | Exceptional 11.9% |
| Kenyans | 94.5 /100 | #133 | Exceptional 11.9% |
| Immigrants | Nicaragua | 94.5 /100 | #134 | Exceptional 11.9% |
| Central Americans | 94.2 /100 | #135 | Exceptional 11.9% |
| Ugandans | 94.0 /100 | #136 | Exceptional 11.9% |
| Immigrants | Norway | 93.8 /100 | #137 | Exceptional 11.9% |
| Ecuadorians | 93.4 /100 | #138 | Exceptional 11.9% |
| Immigrants | Hungary | 92.8 /100 | #139 | Exceptional 11.9% |
| Romanians | 91.6 /100 | #140 | Exceptional 11.9% |
| Immigrants | Ecuador | 91.5 /100 | #141 | Exceptional 11.9% |
| Immigrants | Africa | 90.0 /100 | #142 | Excellent 11.9% |
| Immigrants | Sudan | 89.6 /100 | #143 | Excellent 11.9% |
| Immigrants | Austria | 87.9 /100 | #144 | Excellent 12.0% |
| Estonians | 87.8 /100 | #145 | Excellent 12.0% |