Immigrants from Netherlands vs Ecuadorian Female Disability
COMPARE
Immigrants from Netherlands
Ecuadorian
Female Disability
Female Disability Comparison
Immigrants from Netherlands
Ecuadorians
11.8%
FEMALE DISABILITY
96.9/ 100
METRIC RATING
121st/ 347
METRIC RANK
11.9%
FEMALE DISABILITY
93.4/ 100
METRIC RATING
138th/ 347
METRIC RANK
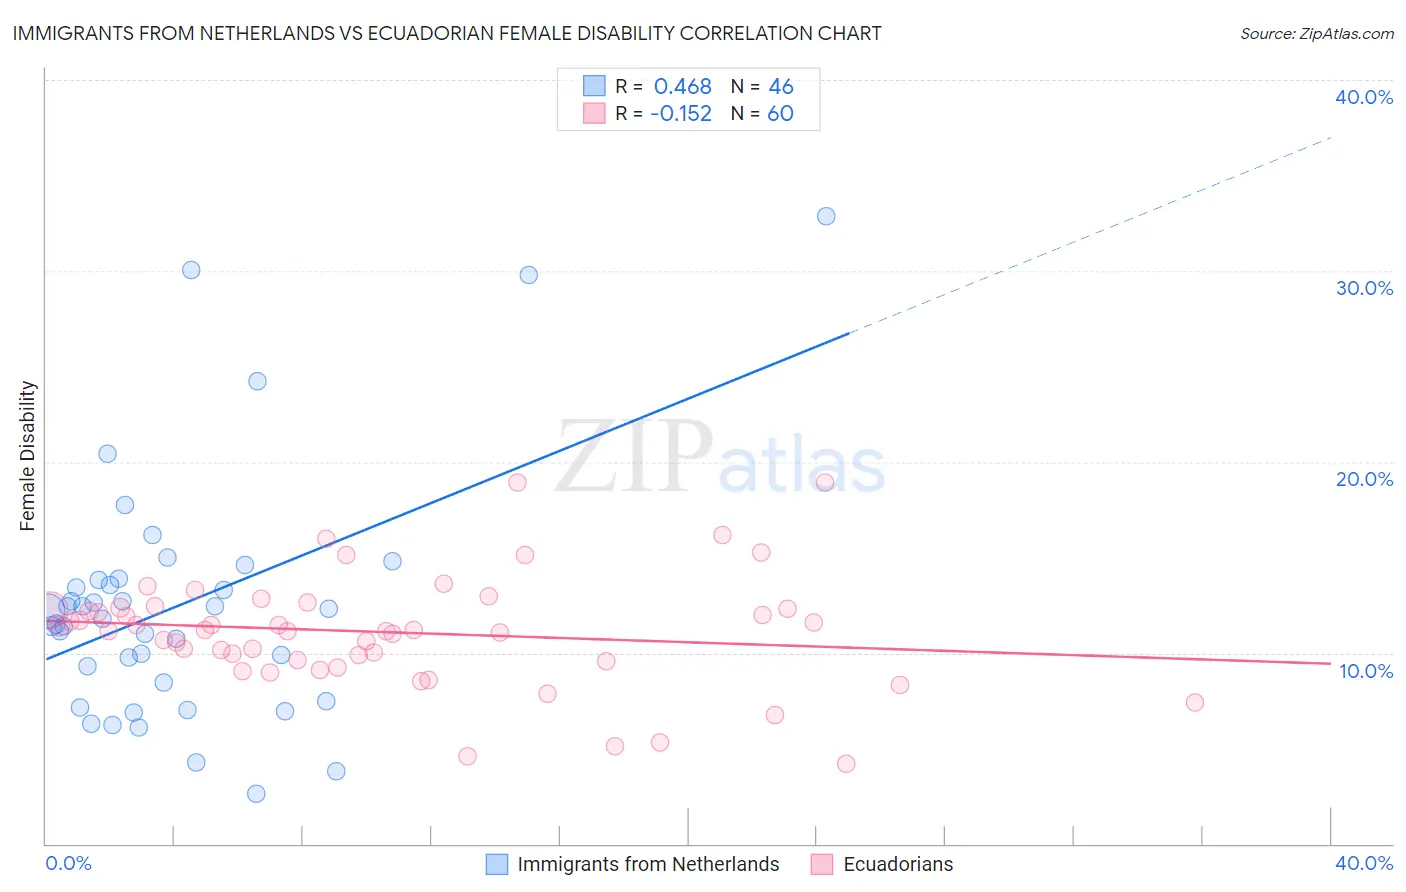
Immigrants from Netherlands vs Ecuadorian Female Disability Correlation Chart
The statistical analysis conducted on geographies consisting of 237,879,368 people shows a moderate positive correlation between the proportion of Immigrants from Netherlands and percentage of females with a disability in the United States with a correlation coefficient (R) of 0.468 and weighted average of 11.8%. Similarly, the statistical analysis conducted on geographies consisting of 317,804,285 people shows a poor negative correlation between the proportion of Ecuadorians and percentage of females with a disability in the United States with a correlation coefficient (R) of -0.152 and weighted average of 11.9%, a difference of 0.76%.
Female Disability Correlation Summary
| Measurement | Immigrants from Netherlands | Ecuadorian |
| Minimum | 2.6% | 4.2% |
| Maximum | 32.9% | 18.9% |
| Range | 30.2% | 14.7% |
| Mean | 12.5% | 11.1% |
| Median | 12.0% | 11.2% |
| Interquartile 25% (IQ1) | 8.4% | 9.6% |
| Interquartile 75% (IQ3) | 13.8% | 12.3% |
| Interquartile Range (IQR) | 5.4% | 2.7% |
| Standard Deviation (Sample) | 6.4% | 2.9% |
| Standard Deviation (Population) | 6.3% | 2.9% |
Demographics Similar to Immigrants from Netherlands and Ecuadorians by Female Disability
In terms of female disability, the demographic groups most similar to Immigrants from Netherlands are Immigrants from North Macedonia (11.8%, a difference of 0.010%), Immigrants from Kazakhstan (11.8%, a difference of 0.030%), Immigrants from Croatia (11.8%, a difference of 0.060%), Immigrants from Uganda (11.8%, a difference of 0.11%), and Russian (11.8%, a difference of 0.11%). Similarly, the demographic groups most similar to Ecuadorians are Immigrants from Norway (11.9%, a difference of 0.060%), Immigrants from Hungary (11.9%, a difference of 0.090%), Ugandan (11.9%, a difference of 0.10%), Central American (11.9%, a difference of 0.12%), and Kenyan (11.9%, a difference of 0.19%).
| Demographics | Rating | Rank | Female Disability |
| Immigrants | Uganda | 97.2 /100 | #119 | Exceptional 11.8% |
| Immigrants | Kazakhstan | 97.0 /100 | #120 | Exceptional 11.8% |
| Immigrants | Netherlands | 96.9 /100 | #121 | Exceptional 11.8% |
| Immigrants | North Macedonia | 96.8 /100 | #122 | Exceptional 11.8% |
| Immigrants | Croatia | 96.7 /100 | #123 | Exceptional 11.8% |
| Russians | 96.5 /100 | #124 | Exceptional 11.8% |
| Immigrants | Italy | 96.4 /100 | #125 | Exceptional 11.8% |
| Immigrants | Europe | 96.2 /100 | #126 | Exceptional 11.8% |
| South American Indians | 95.8 /100 | #127 | Exceptional 11.8% |
| Immigrants | Latvia | 95.6 /100 | #128 | Exceptional 11.8% |
| Macedonians | 95.5 /100 | #129 | Exceptional 11.8% |
| Nicaraguans | 95.2 /100 | #130 | Exceptional 11.9% |
| Arabs | 95.1 /100 | #131 | Exceptional 11.9% |
| Immigrants | Syria | 94.6 /100 | #132 | Exceptional 11.9% |
| Kenyans | 94.5 /100 | #133 | Exceptional 11.9% |
| Immigrants | Nicaragua | 94.5 /100 | #134 | Exceptional 11.9% |
| Central Americans | 94.2 /100 | #135 | Exceptional 11.9% |
| Ugandans | 94.0 /100 | #136 | Exceptional 11.9% |
| Immigrants | Norway | 93.8 /100 | #137 | Exceptional 11.9% |
| Ecuadorians | 93.4 /100 | #138 | Exceptional 11.9% |
| Immigrants | Hungary | 92.8 /100 | #139 | Exceptional 11.9% |