Immigrants from Indonesia vs Eastern European Female Disability
COMPARE
Immigrants from Indonesia
Eastern European
Female Disability
Female Disability Comparison
Immigrants from Indonesia
Eastern Europeans
11.2%
FEMALE DISABILITY
100.0/ 100
METRIC RATING
34th/ 347
METRIC RANK
11.5%
FEMALE DISABILITY
99.7/ 100
METRIC RATING
81st/ 347
METRIC RANK
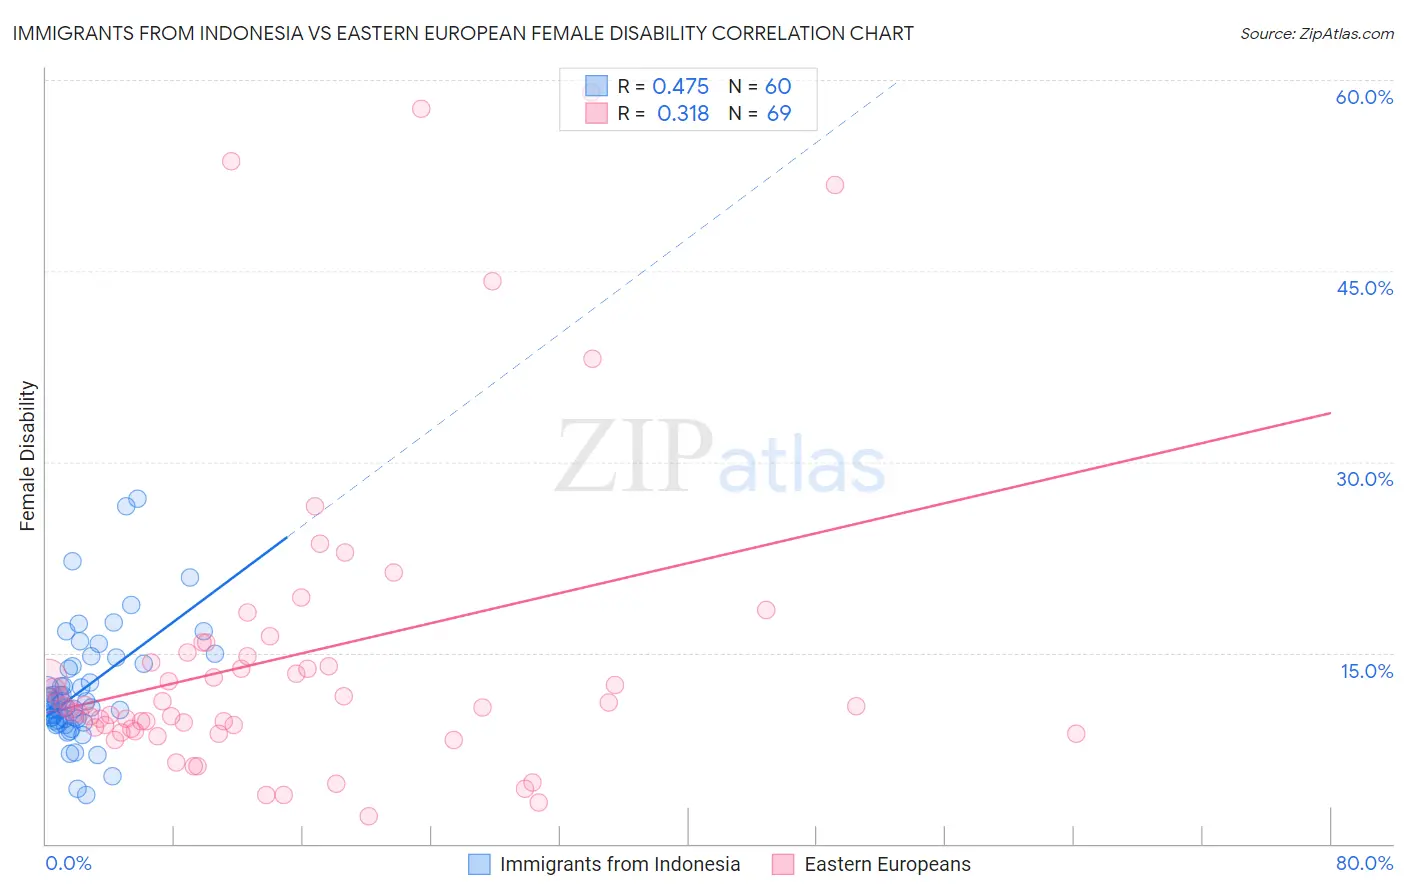
Immigrants from Indonesia vs Eastern European Female Disability Correlation Chart
The statistical analysis conducted on geographies consisting of 215,789,523 people shows a moderate positive correlation between the proportion of Immigrants from Indonesia and percentage of females with a disability in the United States with a correlation coefficient (R) of 0.475 and weighted average of 11.2%. Similarly, the statistical analysis conducted on geographies consisting of 461,176,022 people shows a mild positive correlation between the proportion of Eastern Europeans and percentage of females with a disability in the United States with a correlation coefficient (R) of 0.318 and weighted average of 11.5%, a difference of 3.3%.
Female Disability Correlation Summary
| Measurement | Immigrants from Indonesia | Eastern European |
| Minimum | 3.8% | 2.2% |
| Maximum | 27.1% | 59.0% |
| Range | 23.3% | 56.8% |
| Mean | 12.1% | 14.7% |
| Median | 11.2% | 10.8% |
| Interquartile 25% (IQ1) | 9.7% | 8.9% |
| Interquartile 75% (IQ3) | 14.1% | 14.8% |
| Interquartile Range (IQR) | 4.4% | 5.9% |
| Standard Deviation (Sample) | 4.5% | 12.3% |
| Standard Deviation (Population) | 4.5% | 12.2% |
Similar Demographics by Female Disability
Demographics Similar to Immigrants from Indonesia by Female Disability
In terms of female disability, the demographic groups most similar to Immigrants from Indonesia are Immigrants from Japan (11.2%, a difference of 0.15%), Cypriot (11.2%, a difference of 0.21%), Ethiopian (11.2%, a difference of 0.22%), Immigrants from Egypt (11.1%, a difference of 0.25%), and Immigrants from Ethiopia (11.2%, a difference of 0.25%).
| Demographics | Rating | Rank | Female Disability |
| Immigrants | Turkey | 100.0 /100 | #27 | Exceptional 11.1% |
| Egyptians | 100.0 /100 | #28 | Exceptional 11.1% |
| Immigrants | Malaysia | 100.0 /100 | #29 | Exceptional 11.1% |
| Turks | 100.0 /100 | #30 | Exceptional 11.1% |
| Immigrants | Kuwait | 100.0 /100 | #31 | Exceptional 11.1% |
| Immigrants | Australia | 100.0 /100 | #32 | Exceptional 11.1% |
| Immigrants | Egypt | 100.0 /100 | #33 | Exceptional 11.1% |
| Immigrants | Indonesia | 100.0 /100 | #34 | Exceptional 11.2% |
| Immigrants | Japan | 100.0 /100 | #35 | Exceptional 11.2% |
| Cypriots | 100.0 /100 | #36 | Exceptional 11.2% |
| Ethiopians | 100.0 /100 | #37 | Exceptional 11.2% |
| Immigrants | Ethiopia | 100.0 /100 | #38 | Exceptional 11.2% |
| Immigrants | Lithuania | 100.0 /100 | #39 | Exceptional 11.2% |
| Mongolians | 100.0 /100 | #40 | Exceptional 11.2% |
| Paraguayans | 100.0 /100 | #41 | Exceptional 11.2% |
Demographics Similar to Eastern Europeans by Female Disability
In terms of female disability, the demographic groups most similar to Eastern Europeans are Immigrants from Jordan (11.5%, a difference of 0.14%), Sierra Leonean (11.5%, a difference of 0.15%), Immigrants from South Africa (11.5%, a difference of 0.17%), Immigrants from Eritrea (11.5%, a difference of 0.18%), and Immigrants from Afghanistan (11.5%, a difference of 0.18%).
| Demographics | Rating | Rank | Female Disability |
| Bhutanese | 99.8 /100 | #74 | Exceptional 11.5% |
| Immigrants | Lebanon | 99.7 /100 | #75 | Exceptional 11.5% |
| Immigrants | Eritrea | 99.7 /100 | #76 | Exceptional 11.5% |
| Immigrants | Afghanistan | 99.7 /100 | #77 | Exceptional 11.5% |
| Immigrants | South Africa | 99.7 /100 | #78 | Exceptional 11.5% |
| Sierra Leoneans | 99.7 /100 | #79 | Exceptional 11.5% |
| Immigrants | Jordan | 99.7 /100 | #80 | Exceptional 11.5% |
| Eastern Europeans | 99.7 /100 | #81 | Exceptional 11.5% |
| Luxembourgers | 99.6 /100 | #82 | Exceptional 11.6% |
| Immigrants | Serbia | 99.6 /100 | #83 | Exceptional 11.6% |
| Immigrants | Poland | 99.6 /100 | #84 | Exceptional 11.6% |
| Palestinians | 99.6 /100 | #85 | Exceptional 11.6% |
| Immigrants | Cameroon | 99.6 /100 | #86 | Exceptional 11.6% |
| Immigrants | Denmark | 99.5 /100 | #87 | Exceptional 11.6% |
| Yup'ik | 99.5 /100 | #88 | Exceptional 11.6% |