Immigrants from Western Asia vs European Male Disability
COMPARE
Immigrants from Western Asia
European
Male Disability
Male Disability Comparison
Immigrants from Western Asia
Europeans
10.6%
MALE DISABILITY
97.8/ 100
METRIC RATING
88th/ 347
METRIC RANK
12.1%
MALE DISABILITY
0.3/ 100
METRIC RATING
257th/ 347
METRIC RANK
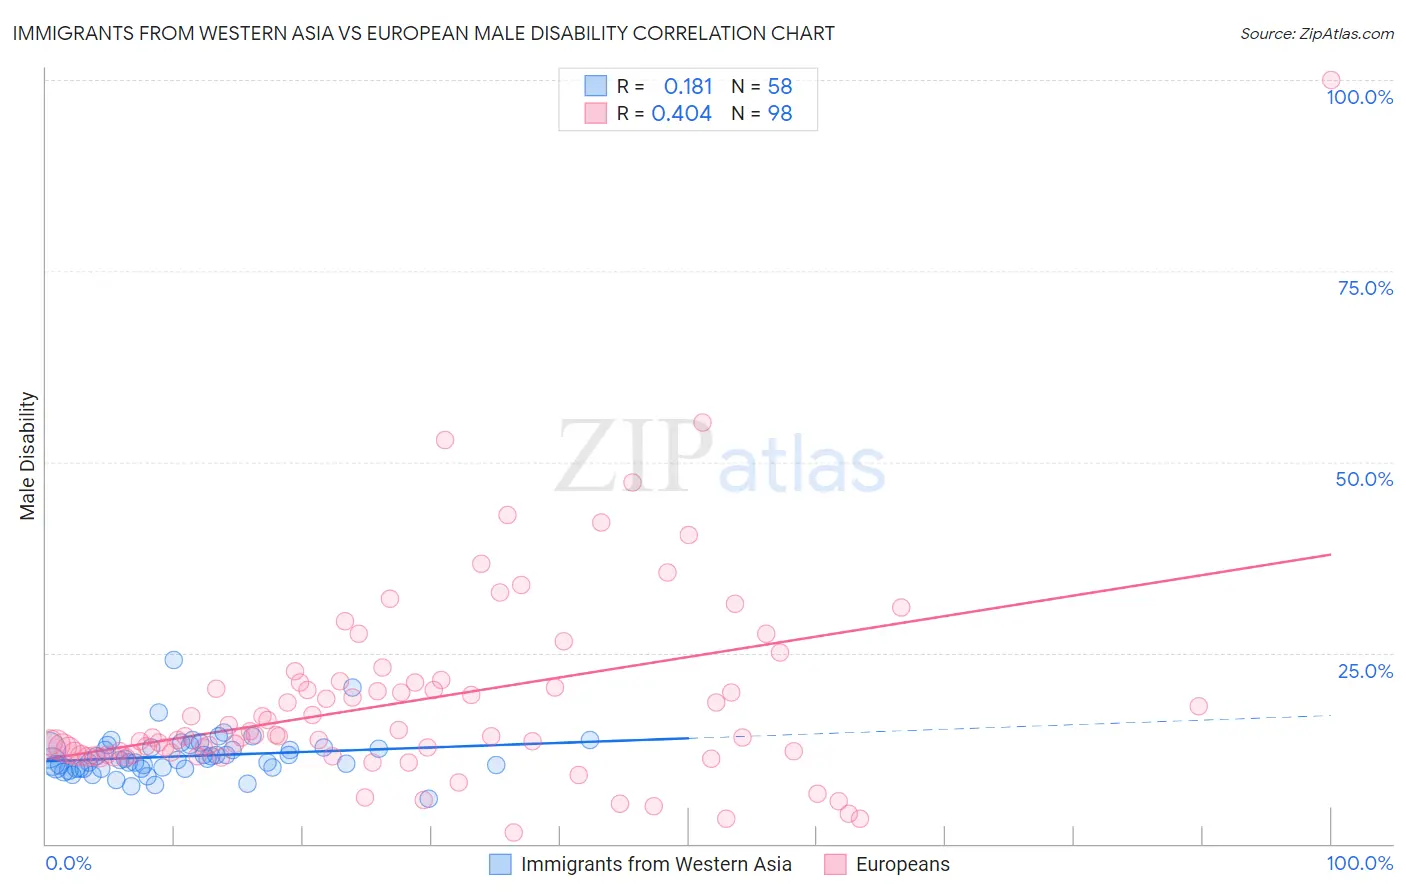
Immigrants from Western Asia vs European Male Disability Correlation Chart
The statistical analysis conducted on geographies consisting of 404,415,030 people shows a poor positive correlation between the proportion of Immigrants from Western Asia and percentage of males with a disability in the United States with a correlation coefficient (R) of 0.181 and weighted average of 10.6%. Similarly, the statistical analysis conducted on geographies consisting of 561,596,268 people shows a moderate positive correlation between the proportion of Europeans and percentage of males with a disability in the United States with a correlation coefficient (R) of 0.404 and weighted average of 12.1%, a difference of 13.8%.
Male Disability Correlation Summary
| Measurement | Immigrants from Western Asia | European |
| Minimum | 5.9% | 1.4% |
| Maximum | 24.0% | 100.0% |
| Range | 18.1% | 98.6% |
| Mean | 11.5% | 18.6% |
| Median | 11.0% | 14.0% |
| Interquartile 25% (IQ1) | 9.9% | 11.6% |
| Interquartile 75% (IQ3) | 12.6% | 21.1% |
| Interquartile Range (IQR) | 2.7% | 9.4% |
| Standard Deviation (Sample) | 2.9% | 13.4% |
| Standard Deviation (Population) | 2.8% | 13.3% |
Similar Demographics by Male Disability
Demographics Similar to Immigrants from Western Asia by Male Disability
In terms of male disability, the demographic groups most similar to Immigrants from Western Asia are Immigrants from Nicaragua (10.6%, a difference of 0.0%), Immigrants from Morocco (10.6%, a difference of 0.050%), Immigrants from Vietnam (10.6%, a difference of 0.070%), Immigrants from Ireland (10.6%, a difference of 0.090%), and Immigrants from France (10.6%, a difference of 0.090%).
| Demographics | Rating | Rank | Male Disability |
| Immigrants | Chile | 98.3 /100 | #81 | Exceptional 10.6% |
| Immigrants | Guyana | 98.2 /100 | #82 | Exceptional 10.6% |
| Immigrants | Poland | 98.1 /100 | #83 | Exceptional 10.6% |
| Bulgarians | 98.1 /100 | #84 | Exceptional 10.6% |
| Sri Lankans | 97.9 /100 | #85 | Exceptional 10.6% |
| Immigrants | Ireland | 97.9 /100 | #86 | Exceptional 10.6% |
| Immigrants | Vietnam | 97.9 /100 | #87 | Exceptional 10.6% |
| Immigrants | Western Asia | 97.8 /100 | #88 | Exceptional 10.6% |
| Immigrants | Nicaragua | 97.8 /100 | #89 | Exceptional 10.6% |
| Immigrants | Morocco | 97.7 /100 | #90 | Exceptional 10.6% |
| Immigrants | France | 97.6 /100 | #91 | Exceptional 10.6% |
| Palestinians | 97.4 /100 | #92 | Exceptional 10.7% |
| Immigrants | St. Vincent and the Grenadines | 97.1 /100 | #93 | Exceptional 10.7% |
| Immigrants | Sweden | 96.9 /100 | #94 | Exceptional 10.7% |
| Chileans | 96.9 /100 | #95 | Exceptional 10.7% |
Demographics Similar to Europeans by Male Disability
In terms of male disability, the demographic groups most similar to Europeans are Swiss (12.1%, a difference of 0.0%), Basque (12.1%, a difference of 0.19%), Belgian (12.1%, a difference of 0.24%), Chinese (12.1%, a difference of 0.25%), and British (12.1%, a difference of 0.26%).
| Demographics | Rating | Rank | Male Disability |
| Bangladeshis | 0.5 /100 | #250 | Tragic 12.0% |
| German Russians | 0.5 /100 | #251 | Tragic 12.0% |
| Slovenes | 0.5 /100 | #252 | Tragic 12.0% |
| Guamanians/Chamorros | 0.5 /100 | #253 | Tragic 12.0% |
| British | 0.4 /100 | #254 | Tragic 12.1% |
| Chinese | 0.4 /100 | #255 | Tragic 12.1% |
| Swiss | 0.3 /100 | #256 | Tragic 12.1% |
| Europeans | 0.3 /100 | #257 | Tragic 12.1% |
| Basques | 0.3 /100 | #258 | Tragic 12.1% |
| Belgians | 0.3 /100 | #259 | Tragic 12.1% |
| Swedes | 0.3 /100 | #260 | Tragic 12.1% |
| Slavs | 0.2 /100 | #261 | Tragic 12.2% |
| Norwegians | 0.2 /100 | #262 | Tragic 12.2% |
| Canadians | 0.2 /100 | #263 | Tragic 12.2% |
| Nepalese | 0.2 /100 | #264 | Tragic 12.2% |