Immigrants from Western Asia vs Immigrants from Argentina Male Disability

COMPARE

Immigrants from Western Asia
Race
Ancestry
AfghanAfricanAlaska NativeAlaskan AthabascanAlbanianAleutAlsatianAmericanApacheArabArapahoArgentineanArmenianAssyrian/Chaldean/SyriacAustralianAustrianBahamianBangladeshiBarbadianBasqueBelgianBelizeanBermudanBhutaneseBlackfeetBolivianBrazilianBritishBritish West IndianBulgarianBurmeseCajunCambodianCanadianCape VerdeanCarpatho RusynCelticCentral AmericanCentral American IndianCherokeeCheyenneChickasawChileanChineseChippewaChoctawColombianColvilleComancheCosta RicanCreeCreekCroatianCrowCubanCypriotCzechCzechoslovakianDanishDelawareDominicanDutchDutch West IndianEastern EuropeanEcuadorianEgyptianEnglishEstonianEthiopianEuropeanFijianFilipinoFinnishFrenchFrench American IndianFrench CanadianGermanGerman RussianGhanaianGreekGuamanian/ChamorroGuatemalanGuyaneseHaitianHmongHonduranHopiHoumaHungarianIcelanderIndian (Asian)IndonesianInupiatIranianIraqiIrishIroquoisIsraeliItalianJamaicanJapaneseJordanianKenyanKiowaKoreanLaotianLatvianLebaneseLiberianLithuanianLumbeeLuxembourgerMacedonianMalaysianMalteseMarshalleseMenomineeMexicanMexican American IndianMongolianMoroccanNative HawaiianNavajoNepaleseNew ZealanderNicaraguanNigerianNorthern EuropeanNorwegianOkinawanOsageOttawaPaiutePakistaniPalestinianPanamanianParaguayanPennsylvania GermanPeruvianPimaPolishPortuguesePotawatomiPuebloPuerto RicanPuget Sound SalishRomanianRussianSalvadoranSamoanScandinavianScotch-IrishScottishSeminoleSenegaleseSerbianShoshoneSierra LeoneanSiouxSlavicSlovakSloveneSomaliSouth AfricanSouth AmericanSouth American IndianSoviet UnionSpaniardSpanishSpanish AmericanSpanish American IndianSri LankanSubsaharan AfricanSudaneseSwedishSwissSyrianTaiwaneseThaiTlingit-HaidaTohono O'OdhamTonganTrinidadian and TobagonianTsimshianTurkishU.S. Virgin IslanderUgandanUkrainianUruguayanUteVenezuelanVietnameseWelshWest IndianYakamaYaquiYugoslavianYumanYup'ikZimbabwean
Immigration
NonimmigrantsImmigrantsAfghanistanAfricaAlbaniaArmeniaAsiaAustraliaAustriaBahamasBangladeshBarbadosBelarusBelgiumBelizeBoliviaBosnia and HerzegovinaBrazilBulgariaBurma/MyanmarCabo VerdeCambodiaCameroonCanadaCaribbeanCentral AmericaChileChinaColombiaCongoCosta RicaCroatiaCubaCzechoslovakiaDenmarkDominicaDominican RepublicEastern AfricaEastern AsiaEastern EuropeEcuadorEgyptEl SalvadorEnglandEritreaEthiopiaEuropeFijiFranceGermanyGhanaGreeceGrenadaGuatemalaGuyanaHaitiHondurasHong KongHungaryIndiaIndonesiaIranIraqIrelandIsraelItalyJamaicaJapanJordanKazakhstanKenyaKoreaKuwaitLaosLatin AmericaLatviaLebanonLiberiaLithuaniaMalaysiaMexicoMicronesiaMiddle AfricaMoldovaMoroccoNepalNetherlandsNicaraguaNigeriaNorth AmericaNorth MacedoniaNorthern AfricaNorthern EuropeNorwayOceaniaPakistanPanamaPeruPhilippinesPolandPortugalRomaniaRussiaSaudi ArabiaScotlandSenegalSerbiaSierra LeoneSingaporeSomaliaSouth AfricaSouth AmericaSouth Central AsiaSouth Eastern AsiaSouthern EuropeSpainSri LankaSt. Vincent and the GrenadinesSudanSwedenSwitzerlandSyriaTaiwanThailandTrinidad and TobagoTurkeyUgandaUkraineUruguayUzbekistanVenezuelaVietnamWest IndiesWestern AfricaWestern AsiaWestern EuropeYemenZaireZimbabweAzores
Immigrants from Argentina
Race
Ancestry
AfghanAfricanAlaska NativeAlaskan AthabascanAlbanianAleutAlsatianAmericanApacheArabArapahoArgentineanArmenianAssyrian/Chaldean/SyriacAustralianAustrianBahamianBangladeshiBarbadianBasqueBelgianBelizeanBermudanBhutaneseBlackfeetBolivianBrazilianBritishBritish West IndianBulgarianBurmeseCajunCambodianCanadianCape VerdeanCarpatho RusynCelticCentral AmericanCentral American IndianCherokeeCheyenneChickasawChileanChineseChippewaChoctawColombianColvilleComancheCosta RicanCreeCreekCroatianCrowCubanCypriotCzechCzechoslovakianDanishDelawareDominicanDutchDutch West IndianEastern EuropeanEcuadorianEgyptianEnglishEstonianEthiopianEuropeanFijianFilipinoFinnishFrenchFrench American IndianFrench CanadianGermanGerman RussianGhanaianGreekGuamanian/ChamorroGuatemalanGuyaneseHaitianHmongHonduranHopiHoumaHungarianIcelanderIndian (Asian)IndonesianInupiatIranianIraqiIrishIroquoisIsraeliItalianJamaicanJapaneseJordanianKenyanKiowaKoreanLaotianLatvianLebaneseLiberianLithuanianLumbeeLuxembourgerMacedonianMalaysianMalteseMarshalleseMenomineeMexicanMexican American IndianMongolianMoroccanNative HawaiianNavajoNepaleseNew ZealanderNicaraguanNigerianNorthern EuropeanNorwegianOkinawanOsageOttawaPaiutePakistaniPalestinianPanamanianParaguayanPennsylvania GermanPeruvianPimaPolishPortuguesePotawatomiPuebloPuerto RicanPuget Sound SalishRomanianRussianSalvadoranSamoanScandinavianScotch-IrishScottishSeminoleSenegaleseSerbianShoshoneSierra LeoneanSiouxSlavicSlovakSloveneSomaliSouth AfricanSouth AmericanSouth American IndianSoviet UnionSpaniardSpanishSpanish AmericanSpanish American IndianSri LankanSubsaharan AfricanSudaneseSwedishSwissSyrianTaiwaneseThaiTlingit-HaidaTohono O'OdhamTonganTrinidadian and TobagonianTsimshianTurkishU.S. Virgin IslanderUgandanUkrainianUruguayanUteVenezuelanVietnameseWelshWest IndianYakamaYaquiYugoslavianYumanYup'ikZimbabwean
Immigration
NonimmigrantsImmigrantsAfghanistanAfricaAlbaniaArgentinaArmeniaAsiaAustraliaAustriaBahamasBangladeshBarbadosBelarusBelgiumBelizeBoliviaBosnia and HerzegovinaBrazilBulgariaBurma/MyanmarCabo VerdeCambodiaCameroonCanadaCaribbeanCentral AmericaChileChinaColombiaCongoCosta RicaCroatiaCubaCzechoslovakiaDenmarkDominicaDominican RepublicEastern AfricaEastern AsiaEastern EuropeEcuadorEgyptEl SalvadorEnglandEritreaEthiopiaEuropeFijiFranceGermanyGhanaGreeceGrenadaGuatemalaGuyanaHaitiHondurasHong KongHungaryIndiaIndonesiaIranIraqIrelandIsraelItalyJamaicaJapanJordanKazakhstanKenyaKoreaKuwaitLaosLatin AmericaLatviaLebanonLiberiaLithuaniaMalaysiaMexicoMicronesiaMiddle AfricaMoldovaMoroccoNepalNetherlandsNicaraguaNigeriaNorth AmericaNorth MacedoniaNorthern AfricaNorthern EuropeNorwayOceaniaPakistanPanamaPeruPhilippinesPolandPortugalRomaniaRussiaSaudi ArabiaScotlandSenegalSerbiaSierra LeoneSingaporeSomaliaSouth AfricaSouth AmericaSouth Central AsiaSouth Eastern AsiaSouthern EuropeSpainSri LankaSt. Vincent and the GrenadinesSudanSwedenSwitzerlandSyriaTaiwanThailandTrinidad and TobagoTurkeyUgandaUkraineUruguayUzbekistanVenezuelaVietnamWest IndiesWestern AfricaWestern EuropeYemenZaireZimbabweAzores
Male Disability
Income
Poverty
Unemployment
Labor Participation
Family Structure
Vehicle Availability
Education Level
Disability

Male Disability Comparison

Immigrants from Western Asia

Immigrants from Argentina

Exceptional
Exceptional
10.6%
MALE DISABILITY
97.8/ 100
METRIC RATING
88th/ 347
METRIC RANK
10.2%
MALE DISABILITY
99.9/ 100
METRIC RATING
35th/ 347
METRIC RANK

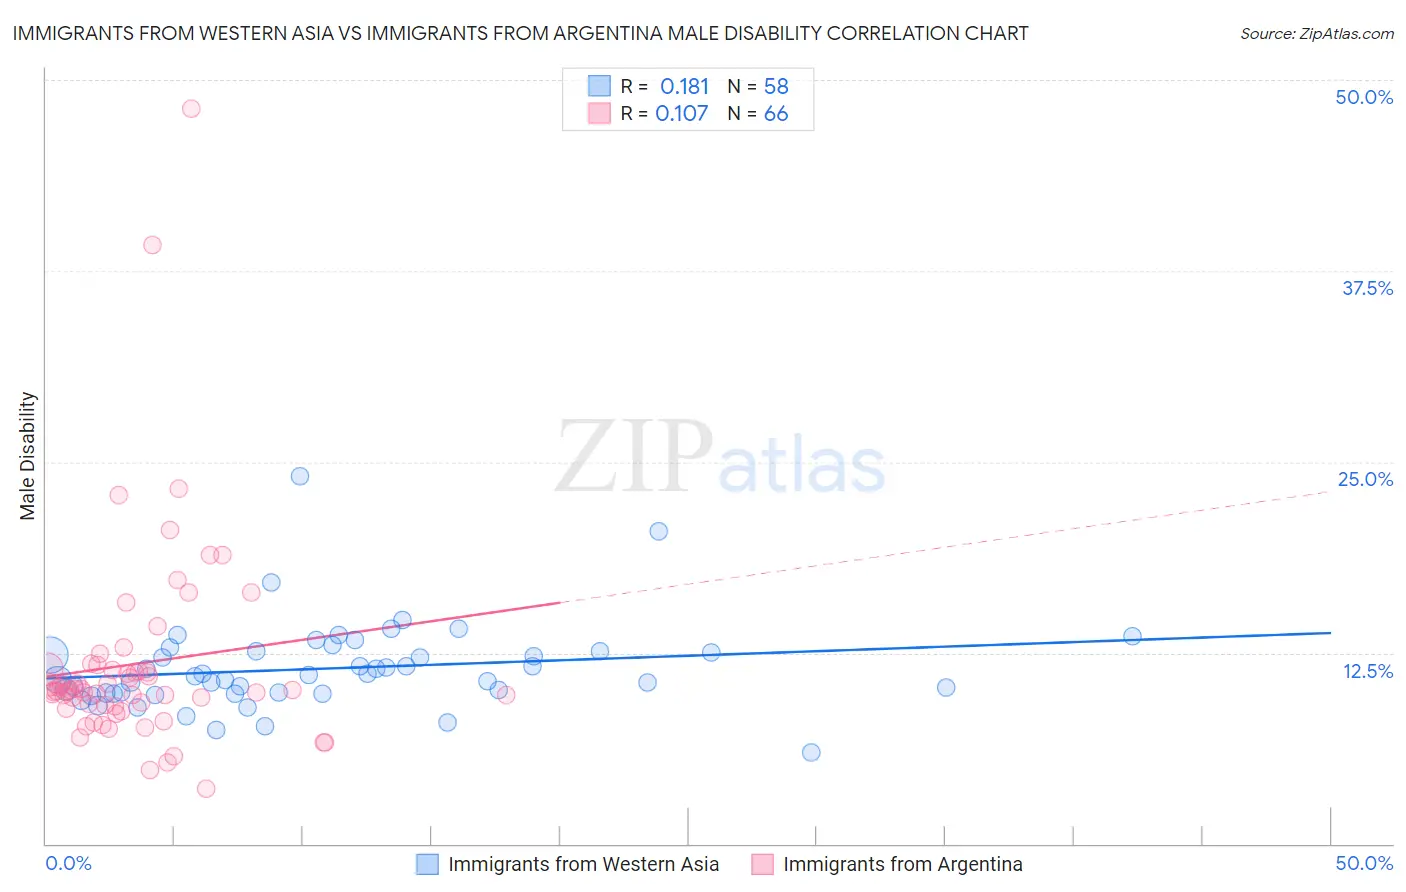
Immigrants from Western Asia vs Immigrants from Argentina Male Disability Correlation Chart

The statistical analysis conducted on geographies consisting of 404,415,030 people shows a poor positive correlation between the proportion of Immigrants from Western Asia and percentage of males with a disability in the United States with a correlation coefficient (R) of 0.181 and weighted average of 10.6%. Similarly, the statistical analysis conducted on geographies consisting of 264,416,468 people shows a poor positive correlation between the proportion of Immigrants from Argentina and percentage of males with a disability in the United States with a correlation coefficient (R) of 0.107 and weighted average of 10.2%, a difference of 4.2%.
Immigrants from Western Asia vs Immigrants from Argentina Male Disability

Male Disability Correlation Summary

MeasurementImmigrants from Western AsiaImmigrants from Argentina
Minimum5.9%3.6%
Maximum24.0%48.1%
Range18.1%44.6%
Mean11.5%11.8%
Median11.0%10.0%
Interquartile 25% (IQ1)9.9%9.0%
Interquartile 75% (IQ3)12.6%11.4%
Interquartile Range (IQR)2.7%2.4%
Standard Deviation (Sample)2.9%6.9%
Standard Deviation (Population)2.8%6.9%

Similar Demographics by Male Disability

Demographics Similar to Immigrants from Western Asia by Male Disability

In terms of male disability, the demographic groups most similar to Immigrants from Western Asia are Immigrants from Nicaragua (10.6%, a difference of 0.0%), Immigrants from Morocco (10.6%, a difference of 0.050%), Immigrants from Vietnam (10.6%, a difference of 0.070%), Immigrants from Ireland (10.6%, a difference of 0.090%), and Immigrants from France (10.6%, a difference of 0.090%).
DemographicsRating | RankMale Disability
Immigrants | Chile
98.3
/100
|
#81
Exceptional
10.6%
Immigrants | Guyana
98.2
/100
|
#82
Exceptional
10.6%
Immigrants | Poland
98.1
/100
|
#83
Exceptional
10.6%
Bulgarians
98.1
/100
|
#84
Exceptional
10.6%
Sri Lankans
97.9
/100
|
#85
Exceptional
10.6%
Immigrants | Ireland
97.9
/100
|
#86
Exceptional
10.6%
Immigrants | Vietnam
97.9
/100
|
#87
Exceptional
10.6%
Immigrants | Western Asia
97.8
/100
|
#88
Exceptional
10.6%
Immigrants | Nicaragua
97.8
/100
|
#89
Exceptional
10.6%
Immigrants | Morocco
97.7
/100
|
#90
Exceptional
10.6%
Immigrants | France
97.6
/100
|
#91
Exceptional
10.6%
Palestinians
97.4
/100
|
#92
Exceptional
10.7%
Immigrants | St. Vincent and the Grenadines
97.1
/100
|
#93
Exceptional
10.7%
Immigrants | Sweden
96.9
/100
|
#94
Exceptional
10.7%
Chileans
96.9
/100
|
#95
Exceptional
10.7%

Demographics Similar to Immigrants from Argentina by Male Disability

In terms of male disability, the demographic groups most similar to Immigrants from Argentina are Ethiopian (10.2%, a difference of 0.050%), Immigrants from Turkey (10.2%, a difference of 0.11%), Immigrants from Indonesia (10.2%, a difference of 0.12%), Immigrants from Ethiopia (10.2%, a difference of 0.17%), and Immigrants from Kuwait (10.2%, a difference of 0.29%).
DemographicsRating | RankMale Disability
Vietnamese
99.9
/100
|
#28
Exceptional
10.1%
Venezuelans
99.9
/100
|
#29
Exceptional
10.1%
Immigrants | Egypt
99.9
/100
|
#30
Exceptional
10.1%
Soviet Union
99.9
/100
|
#31
Exceptional
10.1%
Argentineans
99.9
/100
|
#32
Exceptional
10.1%
Immigrants | Ethiopia
99.9
/100
|
#33
Exceptional
10.2%
Immigrants | Turkey
99.9
/100
|
#34
Exceptional
10.2%
Immigrants | Argentina
99.9
/100
|
#35
Exceptional
10.2%
Ethiopians
99.8
/100
|
#36
Exceptional
10.2%
Immigrants | Indonesia
99.8
/100
|
#37
Exceptional
10.2%
Immigrants | Kuwait
99.8
/100
|
#38
Exceptional
10.2%
Afghans
99.8
/100
|
#39
Exceptional
10.2%
Immigrants | Nepal
99.8
/100
|
#40
Exceptional
10.3%
Taiwanese
99.8
/100
|
#41
Exceptional
10.3%
Mongolians
99.7
/100
|
#42
Exceptional
10.3%