Immigrants from Western Asia vs Cheyenne Hearing Disability
COMPARE
Immigrants from Western Asia
Cheyenne
Hearing Disability
Hearing Disability Comparison
Immigrants from Western Asia
Cheyenne
2.9%
HEARING DISABILITY
86.9/ 100
METRIC RATING
128th/ 347
METRIC RANK
4.0%
HEARING DISABILITY
0.0/ 100
METRIC RATING
318th/ 347
METRIC RANK
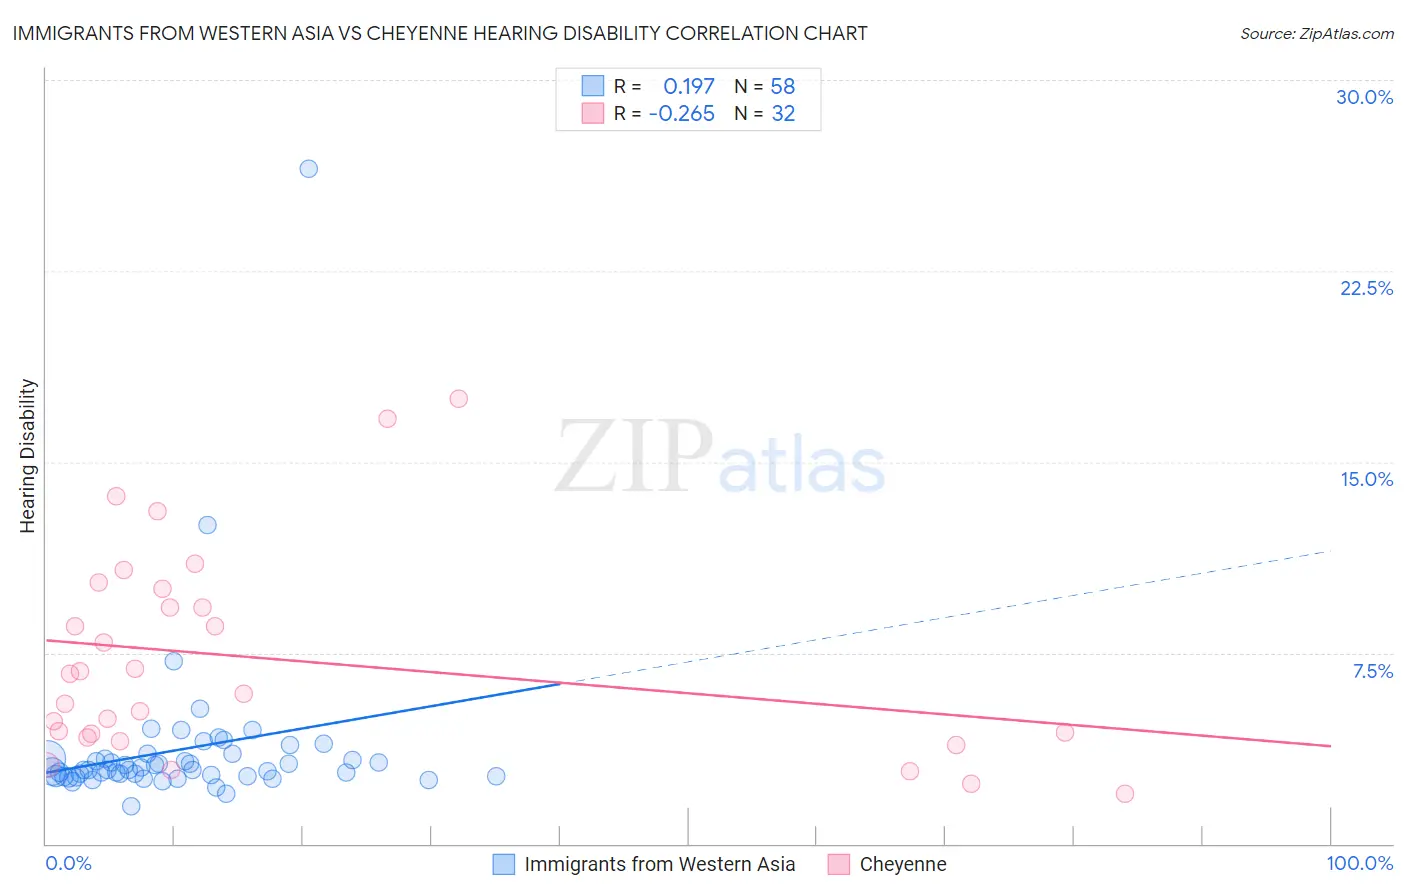
Immigrants from Western Asia vs Cheyenne Hearing Disability Correlation Chart
The statistical analysis conducted on geographies consisting of 404,322,265 people shows a poor positive correlation between the proportion of Immigrants from Western Asia and percentage of population with hearing disability in the United States with a correlation coefficient (R) of 0.197 and weighted average of 2.9%. Similarly, the statistical analysis conducted on geographies consisting of 80,707,533 people shows a weak negative correlation between the proportion of Cheyenne and percentage of population with hearing disability in the United States with a correlation coefficient (R) of -0.265 and weighted average of 4.0%, a difference of 38.6%.
Hearing Disability Correlation Summary
| Measurement | Immigrants from Western Asia | Cheyenne |
| Minimum | 1.5% | 2.0% |
| Maximum | 26.5% | 17.5% |
| Range | 25.0% | 15.5% |
| Mean | 3.7% | 7.2% |
| Median | 2.9% | 6.3% |
| Interquartile 25% (IQ1) | 2.6% | 4.2% |
| Interquartile 75% (IQ3) | 3.4% | 9.6% |
| Interquartile Range (IQR) | 0.72% | 5.4% |
| Standard Deviation (Sample) | 3.4% | 4.0% |
| Standard Deviation (Population) | 3.4% | 4.0% |
Similar Demographics by Hearing Disability
Demographics Similar to Immigrants from Western Asia by Hearing Disability
In terms of hearing disability, the demographic groups most similar to Immigrants from Western Asia are South American Indian (2.9%, a difference of 0.0%), Immigrants from Uganda (2.9%, a difference of 0.050%), Immigrants from Vietnam (2.9%, a difference of 0.070%), Immigrants from Kenya (2.9%, a difference of 0.16%), and Chilean (2.9%, a difference of 0.21%).
| Demographics | Rating | Rank | Hearing Disability |
| Cubans | 89.4 /100 | #121 | Excellent 2.8% |
| Liberians | 89.0 /100 | #122 | Excellent 2.8% |
| Immigrants | Zaire | 88.6 /100 | #123 | Excellent 2.9% |
| Bahamians | 88.6 /100 | #124 | Excellent 2.9% |
| Immigrants | Albania | 88.5 /100 | #125 | Excellent 2.9% |
| Immigrants | Sudan | 87.8 /100 | #126 | Excellent 2.9% |
| South American Indians | 86.9 /100 | #127 | Excellent 2.9% |
| Immigrants | Western Asia | 86.9 /100 | #128 | Excellent 2.9% |
| Immigrants | Uganda | 86.6 /100 | #129 | Excellent 2.9% |
| Immigrants | Vietnam | 86.5 /100 | #130 | Excellent 2.9% |
| Immigrants | Kenya | 86.1 /100 | #131 | Excellent 2.9% |
| Chileans | 85.8 /100 | #132 | Excellent 2.9% |
| Immigrants | Syria | 85.8 /100 | #133 | Excellent 2.9% |
| Ugandans | 85.5 /100 | #134 | Excellent 2.9% |
| Soviet Union | 84.8 /100 | #135 | Excellent 2.9% |
Demographics Similar to Cheyenne by Hearing Disability
In terms of hearing disability, the demographic groups most similar to Cheyenne are Comanche (4.0%, a difference of 0.17%), Spanish American (4.0%, a difference of 0.31%), Puget Sound Salish (3.9%, a difference of 0.51%), Yakama (3.9%, a difference of 0.52%), and Chippewa (4.0%, a difference of 0.65%).
| Demographics | Rating | Rank | Hearing Disability |
| Americans | 0.0 /100 | #311 | Tragic 3.9% |
| Cajuns | 0.0 /100 | #312 | Tragic 3.9% |
| Hopi | 0.0 /100 | #313 | Tragic 3.9% |
| Yakama | 0.0 /100 | #314 | Tragic 3.9% |
| Puget Sound Salish | 0.0 /100 | #315 | Tragic 3.9% |
| Spanish Americans | 0.0 /100 | #316 | Tragic 4.0% |
| Comanche | 0.0 /100 | #317 | Tragic 4.0% |
| Cheyenne | 0.0 /100 | #318 | Tragic 4.0% |
| Chippewa | 0.0 /100 | #319 | Tragic 4.0% |
| Shoshone | 0.0 /100 | #320 | Tragic 4.0% |
| Paiute | 0.0 /100 | #321 | Tragic 4.1% |
| Seminole | 0.0 /100 | #322 | Tragic 4.1% |
| Apache | 0.0 /100 | #323 | Tragic 4.1% |
| Osage | 0.0 /100 | #324 | Tragic 4.1% |
| Lumbee | 0.0 /100 | #325 | Tragic 4.1% |