Immigrants from Nicaragua vs Cheyenne Hearing Disability
COMPARE
Immigrants from Nicaragua
Cheyenne
Hearing Disability
Hearing Disability Comparison
Immigrants from Nicaragua
Cheyenne
2.7%
HEARING DISABILITY
99.0/ 100
METRIC RATING
56th/ 347
METRIC RANK
4.0%
HEARING DISABILITY
0.0/ 100
METRIC RATING
318th/ 347
METRIC RANK
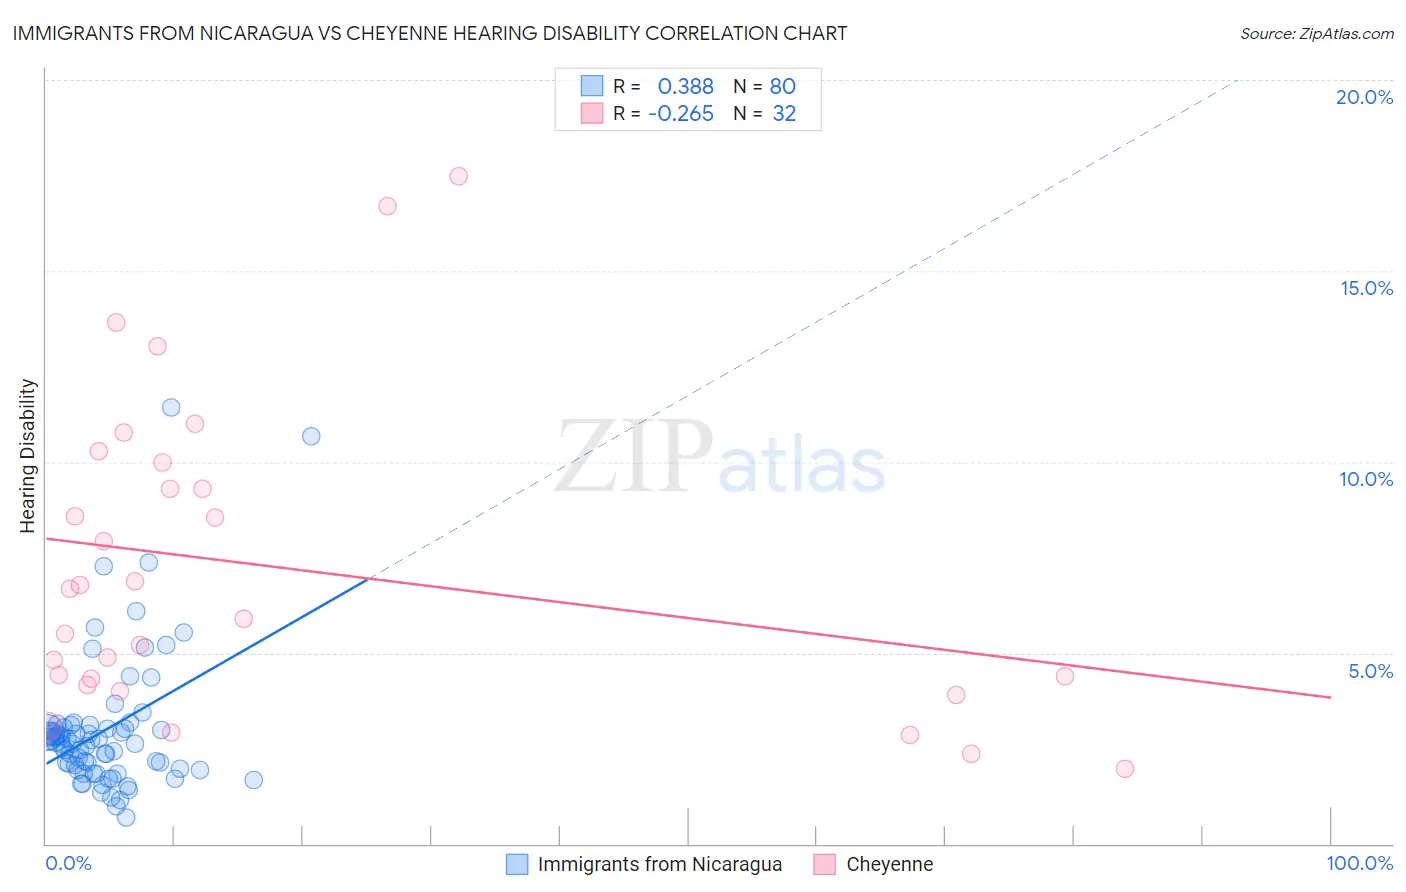
Immigrants from Nicaragua vs Cheyenne Hearing Disability Correlation Chart
The statistical analysis conducted on geographies consisting of 236,296,931 people shows a mild positive correlation between the proportion of Immigrants from Nicaragua and percentage of population with hearing disability in the United States with a correlation coefficient (R) of 0.388 and weighted average of 2.7%. Similarly, the statistical analysis conducted on geographies consisting of 80,707,533 people shows a weak negative correlation between the proportion of Cheyenne and percentage of population with hearing disability in the United States with a correlation coefficient (R) of -0.265 and weighted average of 4.0%, a difference of 48.4%.
Hearing Disability Correlation Summary
| Measurement | Immigrants from Nicaragua | Cheyenne |
| Minimum | 0.69% | 2.0% |
| Maximum | 11.4% | 17.5% |
| Range | 10.7% | 15.5% |
| Mean | 3.0% | 7.2% |
| Median | 2.6% | 6.3% |
| Interquartile 25% (IQ1) | 1.9% | 4.2% |
| Interquartile 75% (IQ3) | 3.0% | 9.6% |
| Interquartile Range (IQR) | 1.1% | 5.4% |
| Standard Deviation (Sample) | 1.8% | 4.0% |
| Standard Deviation (Population) | 1.8% | 4.0% |
Similar Demographics by Hearing Disability
Demographics Similar to Immigrants from Nicaragua by Hearing Disability
In terms of hearing disability, the demographic groups most similar to Immigrants from Nicaragua are Immigrants from Ethiopia (2.7%, a difference of 0.020%), South American (2.7%, a difference of 0.040%), Ethiopian (2.7%, a difference of 0.090%), Immigrants from Eastern Asia (2.7%, a difference of 0.12%), and Jamaican (2.7%, a difference of 0.19%).
| Demographics | Rating | Rank | Hearing Disability |
| Immigrants | South America | 99.2 /100 | #49 | Exceptional 2.7% |
| Paraguayans | 99.2 /100 | #50 | Exceptional 2.7% |
| Immigrants | Hong Kong | 99.2 /100 | #51 | Exceptional 2.7% |
| Jamaicans | 99.0 /100 | #52 | Exceptional 2.7% |
| Immigrants | Eastern Asia | 99.0 /100 | #53 | Exceptional 2.7% |
| Ethiopians | 99.0 /100 | #54 | Exceptional 2.7% |
| Immigrants | Ethiopia | 99.0 /100 | #55 | Exceptional 2.7% |
| Immigrants | Nicaragua | 99.0 /100 | #56 | Exceptional 2.7% |
| South Americans | 99.0 /100 | #57 | Exceptional 2.7% |
| Immigrants | Peru | 98.6 /100 | #58 | Exceptional 2.7% |
| Immigrants | Eritrea | 98.5 /100 | #59 | Exceptional 2.7% |
| Immigrants | Egypt | 98.5 /100 | #60 | Exceptional 2.7% |
| Immigrants | Uzbekistan | 98.4 /100 | #61 | Exceptional 2.7% |
| Immigrants | Colombia | 98.4 /100 | #62 | Exceptional 2.7% |
| Indians (Asian) | 98.4 /100 | #63 | Exceptional 2.7% |
Demographics Similar to Cheyenne by Hearing Disability
In terms of hearing disability, the demographic groups most similar to Cheyenne are Comanche (4.0%, a difference of 0.17%), Spanish American (4.0%, a difference of 0.31%), Puget Sound Salish (3.9%, a difference of 0.51%), Yakama (3.9%, a difference of 0.52%), and Chippewa (4.0%, a difference of 0.65%).
| Demographics | Rating | Rank | Hearing Disability |
| Americans | 0.0 /100 | #311 | Tragic 3.9% |
| Cajuns | 0.0 /100 | #312 | Tragic 3.9% |
| Hopi | 0.0 /100 | #313 | Tragic 3.9% |
| Yakama | 0.0 /100 | #314 | Tragic 3.9% |
| Puget Sound Salish | 0.0 /100 | #315 | Tragic 3.9% |
| Spanish Americans | 0.0 /100 | #316 | Tragic 4.0% |
| Comanche | 0.0 /100 | #317 | Tragic 4.0% |
| Cheyenne | 0.0 /100 | #318 | Tragic 4.0% |
| Chippewa | 0.0 /100 | #319 | Tragic 4.0% |
| Shoshone | 0.0 /100 | #320 | Tragic 4.0% |
| Paiute | 0.0 /100 | #321 | Tragic 4.1% |
| Seminole | 0.0 /100 | #322 | Tragic 4.1% |
| Apache | 0.0 /100 | #323 | Tragic 4.1% |
| Osage | 0.0 /100 | #324 | Tragic 4.1% |
| Lumbee | 0.0 /100 | #325 | Tragic 4.1% |