Bolivian vs Cheyenne Hearing Disability
COMPARE
Bolivian
Cheyenne
Hearing Disability
Hearing Disability Comparison
Bolivians
Cheyenne
2.6%
HEARING DISABILITY
99.7/ 100
METRIC RATING
29th/ 347
METRIC RANK
4.0%
HEARING DISABILITY
0.0/ 100
METRIC RATING
318th/ 347
METRIC RANK
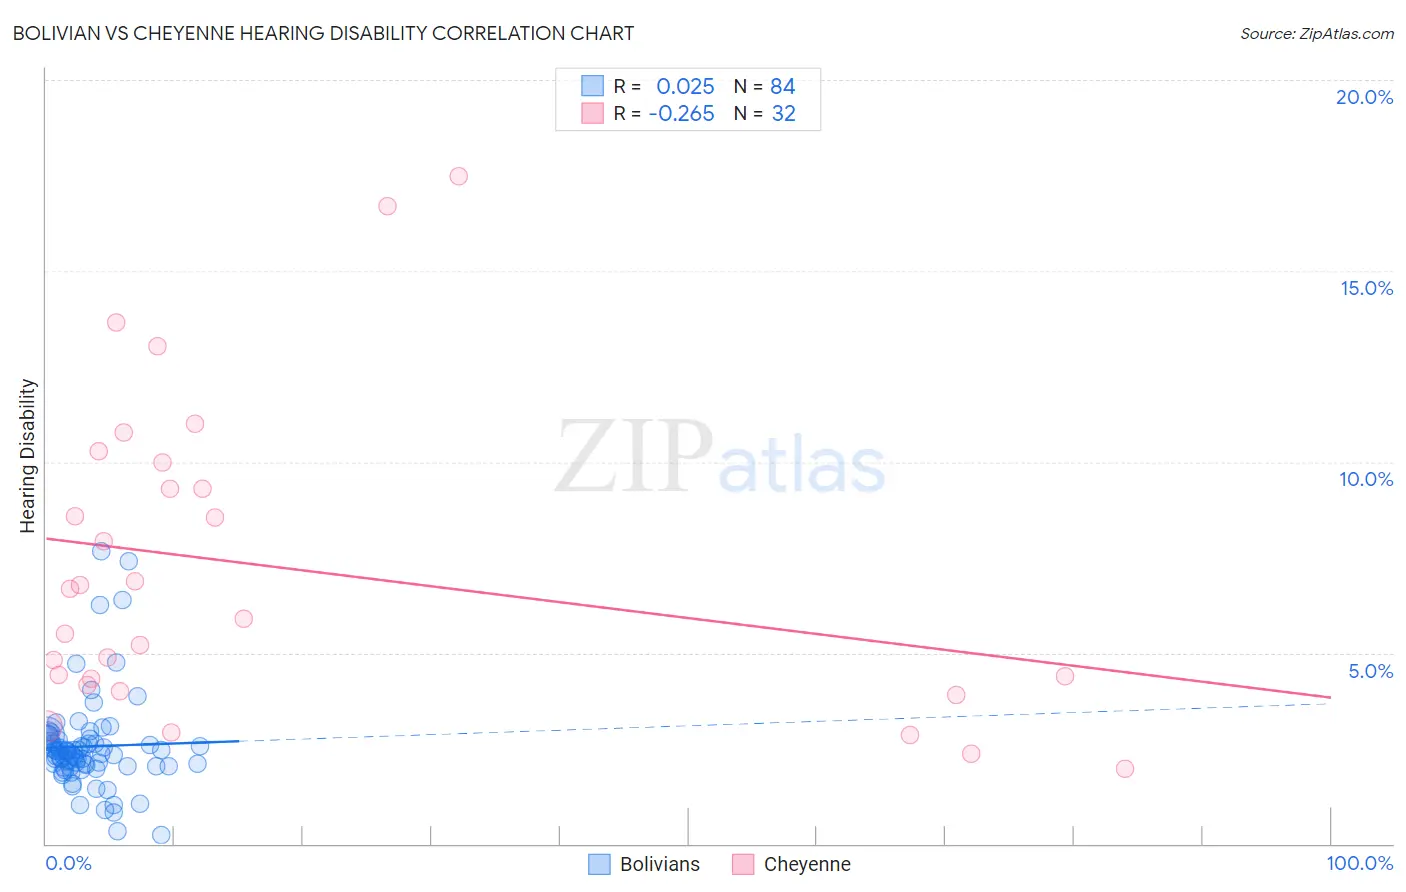
Bolivian vs Cheyenne Hearing Disability Correlation Chart
The statistical analysis conducted on geographies consisting of 184,637,856 people shows no correlation between the proportion of Bolivians and percentage of population with hearing disability in the United States with a correlation coefficient (R) of 0.025 and weighted average of 2.6%. Similarly, the statistical analysis conducted on geographies consisting of 80,707,533 people shows a weak negative correlation between the proportion of Cheyenne and percentage of population with hearing disability in the United States with a correlation coefficient (R) of -0.265 and weighted average of 4.0%, a difference of 53.1%.
Hearing Disability Correlation Summary
| Measurement | Bolivian | Cheyenne |
| Minimum | 0.24% | 2.0% |
| Maximum | 7.7% | 17.5% |
| Range | 7.4% | 15.5% |
| Mean | 2.5% | 7.2% |
| Median | 2.4% | 6.3% |
| Interquartile 25% (IQ1) | 2.0% | 4.2% |
| Interquartile 75% (IQ3) | 2.7% | 9.6% |
| Interquartile Range (IQR) | 0.70% | 5.4% |
| Standard Deviation (Sample) | 1.2% | 4.0% |
| Standard Deviation (Population) | 1.2% | 4.0% |
Similar Demographics by Hearing Disability
Demographics Similar to Bolivians by Hearing Disability
In terms of hearing disability, the demographic groups most similar to Bolivians are Immigrants from Haiti (2.6%, a difference of 0.020%), Immigrants from Caribbean (2.6%, a difference of 0.080%), Immigrants from Cameroon (2.6%, a difference of 0.090%), Immigrants from Venezuela (2.6%, a difference of 0.23%), and Immigrants from South Central Asia (2.6%, a difference of 0.40%).
| Demographics | Rating | Rank | Hearing Disability |
| Immigrants | Sierra Leone | 99.8 /100 | #22 | Exceptional 2.6% |
| Immigrants | Nigeria | 99.8 /100 | #23 | Exceptional 2.6% |
| Immigrants | Ghana | 99.8 /100 | #24 | Exceptional 2.6% |
| Immigrants | El Salvador | 99.7 /100 | #25 | Exceptional 2.6% |
| Immigrants | Senegal | 99.7 /100 | #26 | Exceptional 2.6% |
| Immigrants | South Central Asia | 99.7 /100 | #27 | Exceptional 2.6% |
| Immigrants | Haiti | 99.7 /100 | #28 | Exceptional 2.6% |
| Bolivians | 99.7 /100 | #29 | Exceptional 2.6% |
| Immigrants | Caribbean | 99.7 /100 | #30 | Exceptional 2.6% |
| Immigrants | Cameroon | 99.7 /100 | #31 | Exceptional 2.6% |
| Immigrants | Venezuela | 99.7 /100 | #32 | Exceptional 2.6% |
| Filipinos | 99.6 /100 | #33 | Exceptional 2.6% |
| Immigrants | Pakistan | 99.6 /100 | #34 | Exceptional 2.6% |
| Salvadorans | 99.6 /100 | #35 | Exceptional 2.6% |
| Okinawans | 99.6 /100 | #36 | Exceptional 2.6% |
Demographics Similar to Cheyenne by Hearing Disability
In terms of hearing disability, the demographic groups most similar to Cheyenne are Comanche (4.0%, a difference of 0.17%), Spanish American (4.0%, a difference of 0.31%), Puget Sound Salish (3.9%, a difference of 0.51%), Yakama (3.9%, a difference of 0.52%), and Chippewa (4.0%, a difference of 0.65%).
| Demographics | Rating | Rank | Hearing Disability |
| Americans | 0.0 /100 | #311 | Tragic 3.9% |
| Cajuns | 0.0 /100 | #312 | Tragic 3.9% |
| Hopi | 0.0 /100 | #313 | Tragic 3.9% |
| Yakama | 0.0 /100 | #314 | Tragic 3.9% |
| Puget Sound Salish | 0.0 /100 | #315 | Tragic 3.9% |
| Spanish Americans | 0.0 /100 | #316 | Tragic 4.0% |
| Comanche | 0.0 /100 | #317 | Tragic 4.0% |
| Cheyenne | 0.0 /100 | #318 | Tragic 4.0% |
| Chippewa | 0.0 /100 | #319 | Tragic 4.0% |
| Shoshone | 0.0 /100 | #320 | Tragic 4.0% |
| Paiute | 0.0 /100 | #321 | Tragic 4.1% |
| Seminole | 0.0 /100 | #322 | Tragic 4.1% |
| Apache | 0.0 /100 | #323 | Tragic 4.1% |
| Osage | 0.0 /100 | #324 | Tragic 4.1% |
| Lumbee | 0.0 /100 | #325 | Tragic 4.1% |