Immigrants from Western Africa vs Comanche Vision Disability
COMPARE
Immigrants from Western Africa
Comanche
Vision Disability
Vision Disability Comparison
Immigrants from Western Africa
Comanche
2.3%
VISION DISABILITY
3.4/ 100
METRIC RATING
225th/ 347
METRIC RANK
2.8%
VISION DISABILITY
0.0/ 100
METRIC RATING
321st/ 347
METRIC RANK
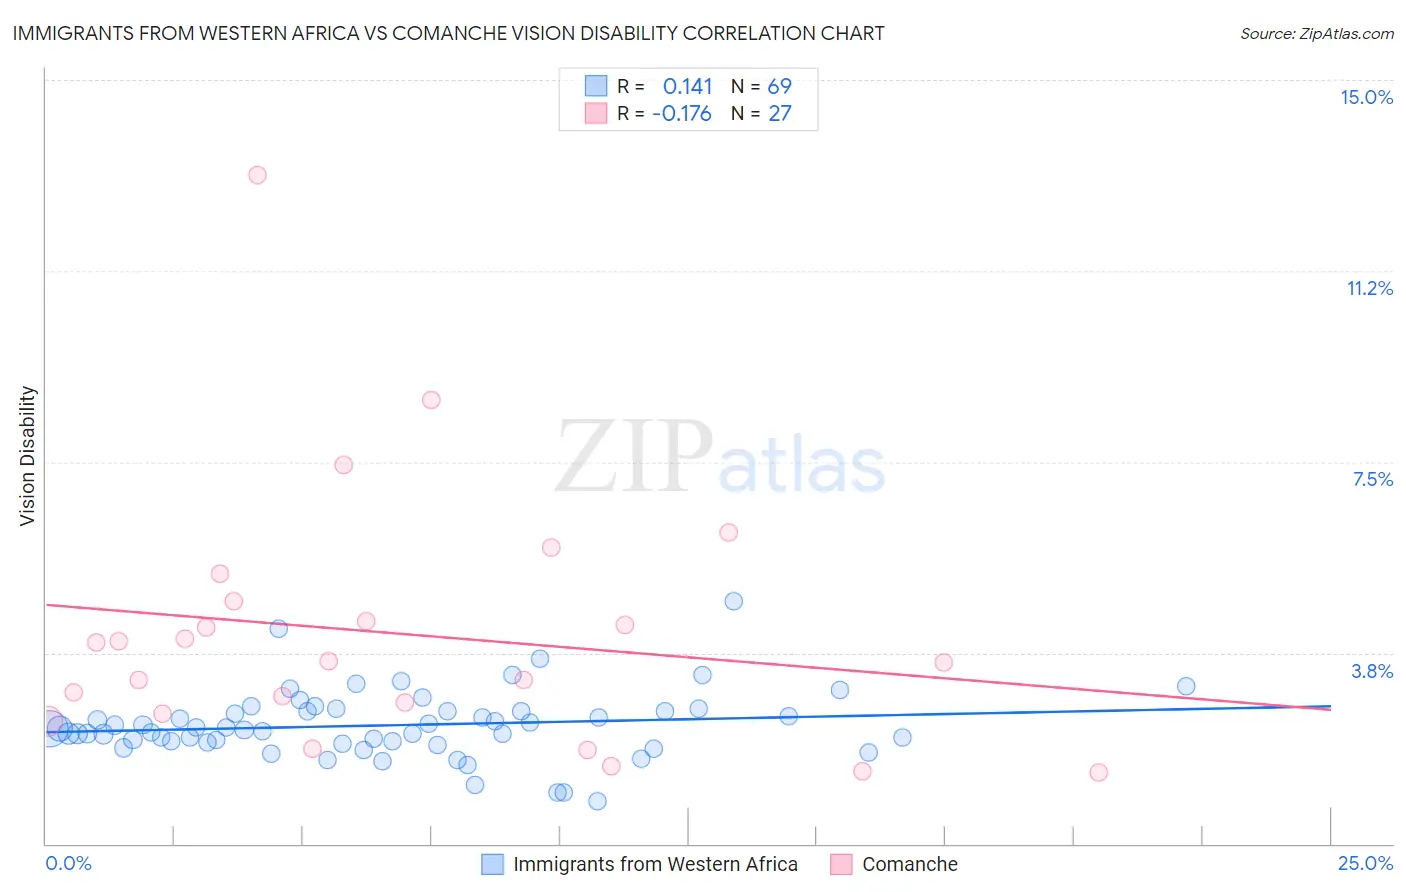
Immigrants from Western Africa vs Comanche Vision Disability Correlation Chart
The statistical analysis conducted on geographies consisting of 357,586,562 people shows a poor positive correlation between the proportion of Immigrants from Western Africa and percentage of population with vision disability in the United States with a correlation coefficient (R) of 0.141 and weighted average of 2.3%. Similarly, the statistical analysis conducted on geographies consisting of 109,767,498 people shows a poor negative correlation between the proportion of Comanche and percentage of population with vision disability in the United States with a correlation coefficient (R) of -0.176 and weighted average of 2.8%, a difference of 24.7%.
Vision Disability Correlation Summary
| Measurement | Immigrants from Western Africa | Comanche |
| Minimum | 0.83% | 1.4% |
| Maximum | 4.8% | 13.1% |
| Range | 3.9% | 11.8% |
| Mean | 2.3% | 4.1% |
| Median | 2.3% | 3.6% |
| Interquartile 25% (IQ1) | 2.0% | 2.6% |
| Interquartile 75% (IQ3) | 2.6% | 4.8% |
| Interquartile Range (IQR) | 0.61% | 2.2% |
| Standard Deviation (Sample) | 0.66% | 2.5% |
| Standard Deviation (Population) | 0.65% | 2.5% |
Similar Demographics by Vision Disability
Demographics Similar to Immigrants from Western Africa by Vision Disability
In terms of vision disability, the demographic groups most similar to Immigrants from Western Africa are Irish (2.3%, a difference of 0.010%), Basque (2.3%, a difference of 0.040%), Immigrants from Senegal (2.3%, a difference of 0.18%), French Canadian (2.3%, a difference of 0.20%), and Guamanian/Chamorro (2.3%, a difference of 0.22%).
| Demographics | Rating | Rank | Vision Disability |
| Portuguese | 4.9 /100 | #218 | Tragic 2.3% |
| Ecuadorians | 4.6 /100 | #219 | Tragic 2.3% |
| Guamanians/Chamorros | 3.9 /100 | #220 | Tragic 2.3% |
| French Canadians | 3.9 /100 | #221 | Tragic 2.3% |
| Immigrants | Senegal | 3.8 /100 | #222 | Tragic 2.3% |
| Basques | 3.5 /100 | #223 | Tragic 2.3% |
| Irish | 3.4 /100 | #224 | Tragic 2.3% |
| Immigrants | Western Africa | 3.4 /100 | #225 | Tragic 2.3% |
| Immigrants | Germany | 3.0 /100 | #226 | Tragic 2.3% |
| Hawaiians | 2.9 /100 | #227 | Tragic 2.3% |
| Hmong | 2.5 /100 | #228 | Tragic 2.3% |
| Welsh | 2.3 /100 | #229 | Tragic 2.3% |
| Nicaraguans | 2.2 /100 | #230 | Tragic 2.3% |
| Immigrants | Ecuador | 2.0 /100 | #231 | Tragic 2.3% |
| German Russians | 1.8 /100 | #232 | Tragic 2.3% |
Demographics Similar to Comanche by Vision Disability
In terms of vision disability, the demographic groups most similar to Comanche are Paiute (2.9%, a difference of 0.42%), Tlingit-Haida (2.9%, a difference of 0.42%), Black/African American (2.8%, a difference of 2.0%), Hopi (2.9%, a difference of 2.4%), and Cherokee (2.9%, a difference of 2.4%).
| Demographics | Rating | Rank | Vision Disability |
| Inupiat | 0.0 /100 | #314 | Tragic 2.7% |
| Osage | 0.0 /100 | #315 | Tragic 2.7% |
| Shoshone | 0.0 /100 | #316 | Tragic 2.7% |
| Yup'ik | 0.0 /100 | #317 | Tragic 2.7% |
| Alaska Natives | 0.0 /100 | #318 | Tragic 2.7% |
| Tohono O'odham | 0.0 /100 | #319 | Tragic 2.8% |
| Blacks/African Americans | 0.0 /100 | #320 | Tragic 2.8% |
| Comanche | 0.0 /100 | #321 | Tragic 2.8% |
| Paiute | 0.0 /100 | #322 | Tragic 2.9% |
| Tlingit-Haida | 0.0 /100 | #323 | Tragic 2.9% |
| Hopi | 0.0 /100 | #324 | Tragic 2.9% |
| Cherokee | 0.0 /100 | #325 | Tragic 2.9% |
| Spanish Americans | 0.0 /100 | #326 | Tragic 2.9% |
| Natives/Alaskans | 0.0 /100 | #327 | Tragic 3.0% |
| Yuman | 0.0 /100 | #328 | Tragic 3.0% |