Immigrants from Western Africa vs Immigrants from Northern Europe Female Disability
COMPARE
Immigrants from Western Africa
Immigrants from Northern Europe
Female Disability
Female Disability Comparison
Immigrants from Western Africa
Immigrants from Northern Europe
12.3%
FEMALE DISABILITY
29.2/ 100
METRIC RATING
192nd/ 347
METRIC RANK
11.6%
FEMALE DISABILITY
99.4/ 100
METRIC RATING
95th/ 347
METRIC RANK
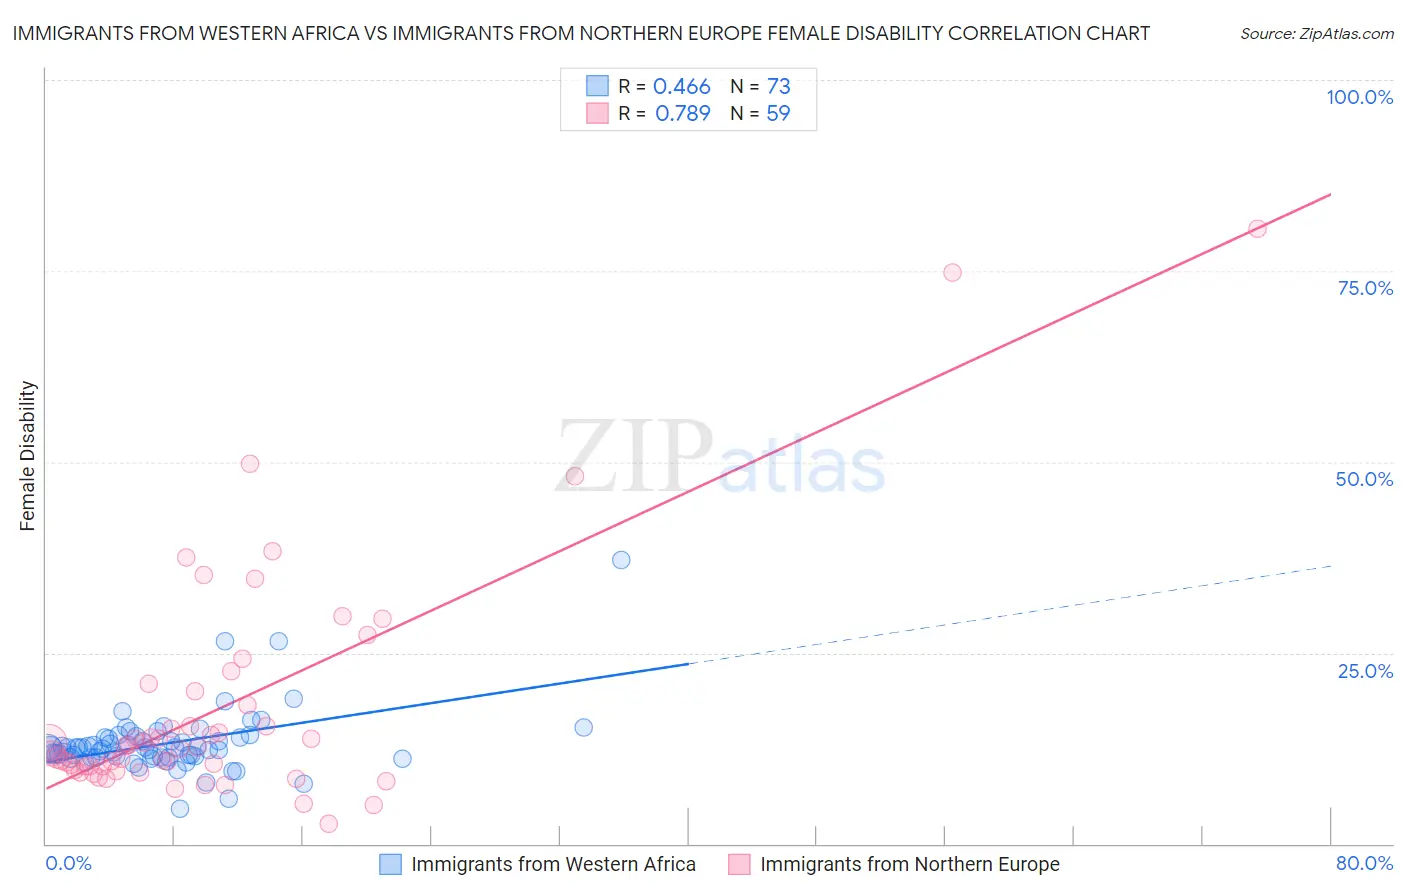
Immigrants from Western Africa vs Immigrants from Northern Europe Female Disability Correlation Chart
The statistical analysis conducted on geographies consisting of 357,800,651 people shows a moderate positive correlation between the proportion of Immigrants from Western Africa and percentage of females with a disability in the United States with a correlation coefficient (R) of 0.466 and weighted average of 12.3%. Similarly, the statistical analysis conducted on geographies consisting of 477,174,714 people shows a strong positive correlation between the proportion of Immigrants from Northern Europe and percentage of females with a disability in the United States with a correlation coefficient (R) of 0.789 and weighted average of 11.6%, a difference of 5.9%.
Female Disability Correlation Summary
| Measurement | Immigrants from Western Africa | Immigrants from Northern Europe |
| Minimum | 4.6% | 2.6% |
| Maximum | 37.1% | 80.5% |
| Range | 32.5% | 77.9% |
| Mean | 13.1% | 17.9% |
| Median | 12.5% | 12.6% |
| Interquartile 25% (IQ1) | 11.3% | 9.7% |
| Interquartile 75% (IQ3) | 13.9% | 19.9% |
| Interquartile Range (IQR) | 2.6% | 10.2% |
| Standard Deviation (Sample) | 4.4% | 15.2% |
| Standard Deviation (Population) | 4.3% | 15.1% |
Similar Demographics by Female Disability
Demographics Similar to Immigrants from Western Africa by Female Disability
In terms of female disability, the demographic groups most similar to Immigrants from Western Africa are Armenian (12.3%, a difference of 0.020%), Northern European (12.3%, a difference of 0.080%), Immigrants from Honduras (12.3%, a difference of 0.090%), Ukrainian (12.3%, a difference of 0.090%), and Immigrants from Albania (12.3%, a difference of 0.10%).
| Demographics | Rating | Rank | Female Disability |
| Immigrants | Uzbekistan | 33.9 /100 | #185 | Fair 12.3% |
| Austrians | 33.3 /100 | #186 | Fair 12.3% |
| Serbians | 33.1 /100 | #187 | Fair 12.3% |
| Immigrants | North America | 32.8 /100 | #188 | Fair 12.3% |
| Immigrants | Albania | 31.6 /100 | #189 | Fair 12.3% |
| Immigrants | Honduras | 31.3 /100 | #190 | Fair 12.3% |
| Armenians | 29.7 /100 | #191 | Fair 12.3% |
| Immigrants | Western Africa | 29.2 /100 | #192 | Fair 12.3% |
| Northern Europeans | 27.5 /100 | #193 | Fair 12.3% |
| Ukrainians | 27.2 /100 | #194 | Fair 12.3% |
| Swedes | 26.6 /100 | #195 | Fair 12.3% |
| Immigrants | Panama | 25.5 /100 | #196 | Fair 12.3% |
| Hondurans | 25.4 /100 | #197 | Fair 12.3% |
| Mexican American Indians | 24.9 /100 | #198 | Fair 12.3% |
| Immigrants | Trinidad and Tobago | 24.7 /100 | #199 | Fair 12.3% |
Demographics Similar to Immigrants from Northern Europe by Female Disability
In terms of female disability, the demographic groups most similar to Immigrants from Northern Europe are Immigrants from Brazil (11.6%, a difference of 0.070%), Immigrants from Sierra Leone (11.6%, a difference of 0.10%), Immigrants from Czechoslovakia (11.6%, a difference of 0.20%), Immigrants from Romania (11.6%, a difference of 0.21%), and Immigrants from Zimbabwe (11.6%, a difference of 0.21%).
| Demographics | Rating | Rank | Female Disability |
| Yup'ik | 99.5 /100 | #88 | Exceptional 11.6% |
| Vietnamese | 99.5 /100 | #89 | Exceptional 11.6% |
| Immigrants | Romania | 99.5 /100 | #90 | Exceptional 11.6% |
| Immigrants | Zimbabwe | 99.5 /100 | #91 | Exceptional 11.6% |
| Immigrants | Czechoslovakia | 99.5 /100 | #92 | Exceptional 11.6% |
| Immigrants | Sierra Leone | 99.4 /100 | #93 | Exceptional 11.6% |
| Immigrants | Brazil | 99.4 /100 | #94 | Exceptional 11.6% |
| Immigrants | Northern Europe | 99.4 /100 | #95 | Exceptional 11.6% |
| Immigrants | Russia | 99.0 /100 | #96 | Exceptional 11.7% |
| Koreans | 99.0 /100 | #97 | Exceptional 11.7% |
| Uruguayans | 98.8 /100 | #98 | Exceptional 11.7% |
| Immigrants | Philippines | 98.6 /100 | #99 | Exceptional 11.7% |
| Immigrants | Uruguay | 98.5 /100 | #100 | Exceptional 11.7% |
| Immigrants | Costa Rica | 98.4 /100 | #101 | Exceptional 11.7% |
| Immigrants | South Eastern Asia | 98.4 /100 | #102 | Exceptional 11.7% |