Immigrants from Western Africa vs American Median Male Earnings
COMPARE
Immigrants from Western Africa
American
Median Male Earnings
Median Male Earnings Comparison
Immigrants from Western Africa
Americans
$50,940
MEDIAN MALE EARNINGS
3.0/ 100
METRIC RATING
235th/ 347
METRIC RANK
$50,761
MEDIAN MALE EARNINGS
2.5/ 100
METRIC RATING
239th/ 347
METRIC RANK
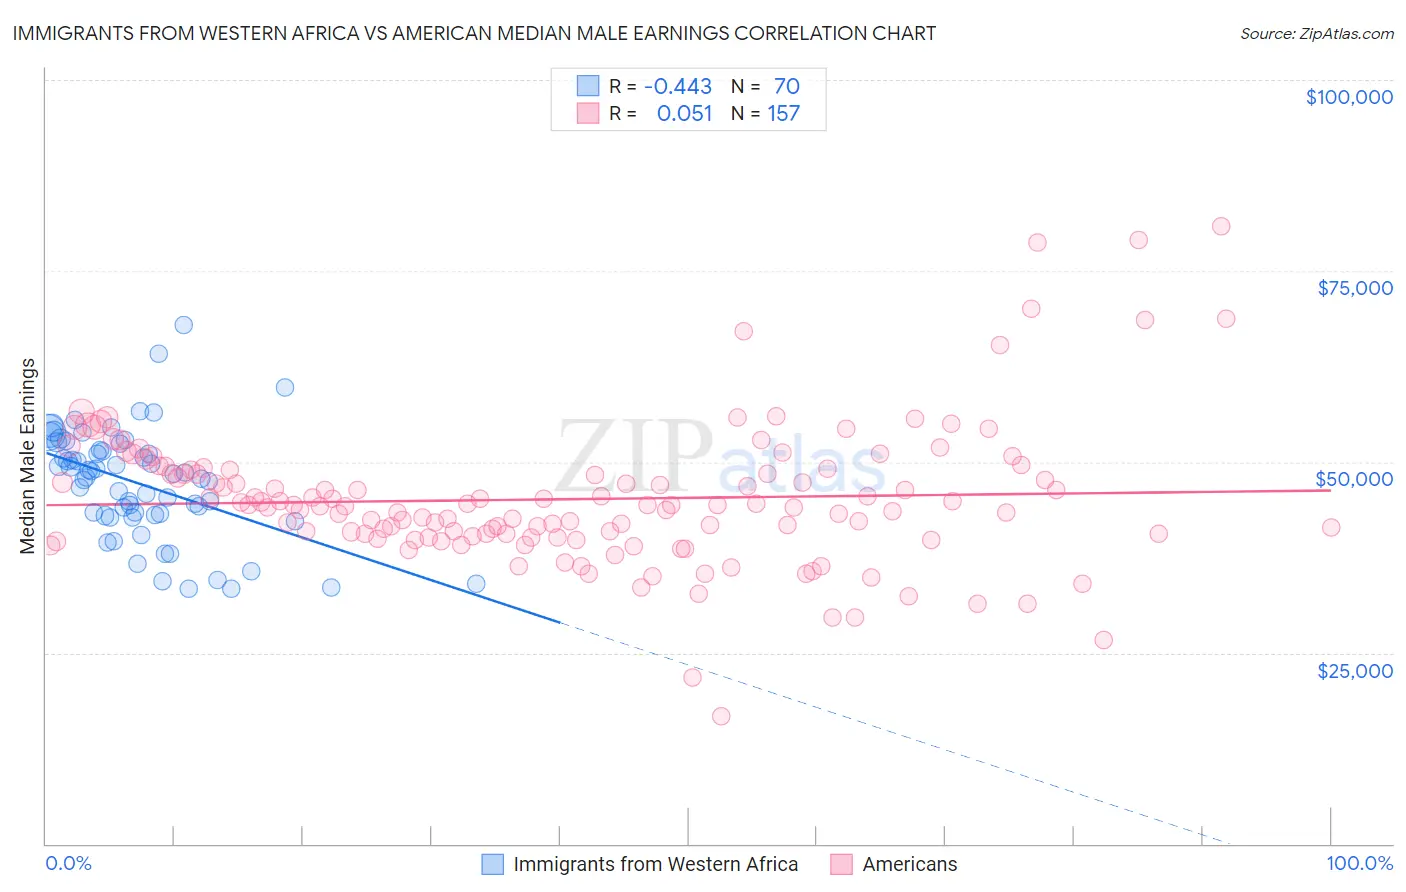
Immigrants from Western Africa vs American Median Male Earnings Correlation Chart
The statistical analysis conducted on geographies consisting of 357,835,205 people shows a moderate negative correlation between the proportion of Immigrants from Western Africa and median male earnings in the United States with a correlation coefficient (R) of -0.443 and weighted average of $50,940. Similarly, the statistical analysis conducted on geographies consisting of 580,042,530 people shows a slight positive correlation between the proportion of Americans and median male earnings in the United States with a correlation coefficient (R) of 0.051 and weighted average of $50,761, a difference of 0.35%.
Median Male Earnings Correlation Summary
| Measurement | Immigrants from Western Africa | American |
| Minimum | $33,371 | $16,756 |
| Maximum | $67,960 | $80,855 |
| Range | $34,589 | $64,099 |
| Mean | $47,183 | $45,104 |
| Median | $48,227 | $44,329 |
| Interquartile 25% (IQ1) | $42,968 | $40,142 |
| Interquartile 75% (IQ3) | $51,502 | $48,927 |
| Interquartile Range (IQR) | $8,534 | $8,785 |
| Standard Deviation (Sample) | $7,172 | $9,213 |
| Standard Deviation (Population) | $7,120 | $9,183 |
Demographics Similar to Immigrants from Western Africa and Americans by Median Male Earnings
In terms of median male earnings, the demographic groups most similar to Immigrants from Western Africa are Pennsylvania German ($50,878, a difference of 0.12%), Immigrants from Barbados ($50,795, a difference of 0.28%), Cape Verdean ($51,103, a difference of 0.32%), Malaysian ($50,772, a difference of 0.33%), and Aleut ($51,168, a difference of 0.45%). Similarly, the demographic groups most similar to Americans are Malaysian ($50,772, a difference of 0.020%), Immigrants from Barbados ($50,795, a difference of 0.070%), West Indian ($50,682, a difference of 0.16%), Immigrants from St. Vincent and the Grenadines ($50,665, a difference of 0.19%), and Pennsylvania German ($50,878, a difference of 0.23%).
| Demographics | Rating | Rank | Median Male Earnings |
| Trinidadians and Tobagonians | 4.8 /100 | #227 | Tragic $51,446 |
| Samoans | 4.6 /100 | #228 | Tragic $51,389 |
| Immigrants | Trinidad and Tobago | 4.5 /100 | #229 | Tragic $51,376 |
| Immigrants | Nigeria | 4.2 /100 | #230 | Tragic $51,310 |
| Barbadians | 3.9 /100 | #231 | Tragic $51,236 |
| Sudanese | 3.9 /100 | #232 | Tragic $51,216 |
| Aleuts | 3.7 /100 | #233 | Tragic $51,168 |
| Cape Verdeans | 3.5 /100 | #234 | Tragic $51,103 |
| Immigrants | Western Africa | 3.0 /100 | #235 | Tragic $50,940 |
| Pennsylvania Germans | 2.8 /100 | #236 | Tragic $50,878 |
| Immigrants | Barbados | 2.6 /100 | #237 | Tragic $50,795 |
| Malaysians | 2.5 /100 | #238 | Tragic $50,772 |
| Americans | 2.5 /100 | #239 | Tragic $50,761 |
| West Indians | 2.3 /100 | #240 | Tragic $50,682 |
| Immigrants | St. Vincent and the Grenadines | 2.3 /100 | #241 | Tragic $50,665 |
| Guyanese | 2.2 /100 | #242 | Tragic $50,613 |
| French American Indians | 2.2 /100 | #243 | Tragic $50,611 |
| Houma | 2.0 /100 | #244 | Tragic $50,547 |
| Hawaiians | 1.9 /100 | #245 | Tragic $50,488 |
| Immigrants | Ecuador | 1.9 /100 | #246 | Tragic $50,474 |
| Sub-Saharan Africans | 1.8 /100 | #247 | Tragic $50,408 |