Immigrants from Western Africa vs Immigrants from Bosnia and Herzegovina Female Disability
COMPARE
Immigrants from Western Africa
Immigrants from Bosnia and Herzegovina
Female Disability
Female Disability Comparison
Immigrants from Western Africa
Immigrants from Bosnia and Herzegovina
12.3%
FEMALE DISABILITY
29.2/ 100
METRIC RATING
192nd/ 347
METRIC RANK
12.4%
FEMALE DISABILITY
14.8/ 100
METRIC RATING
211th/ 347
METRIC RANK
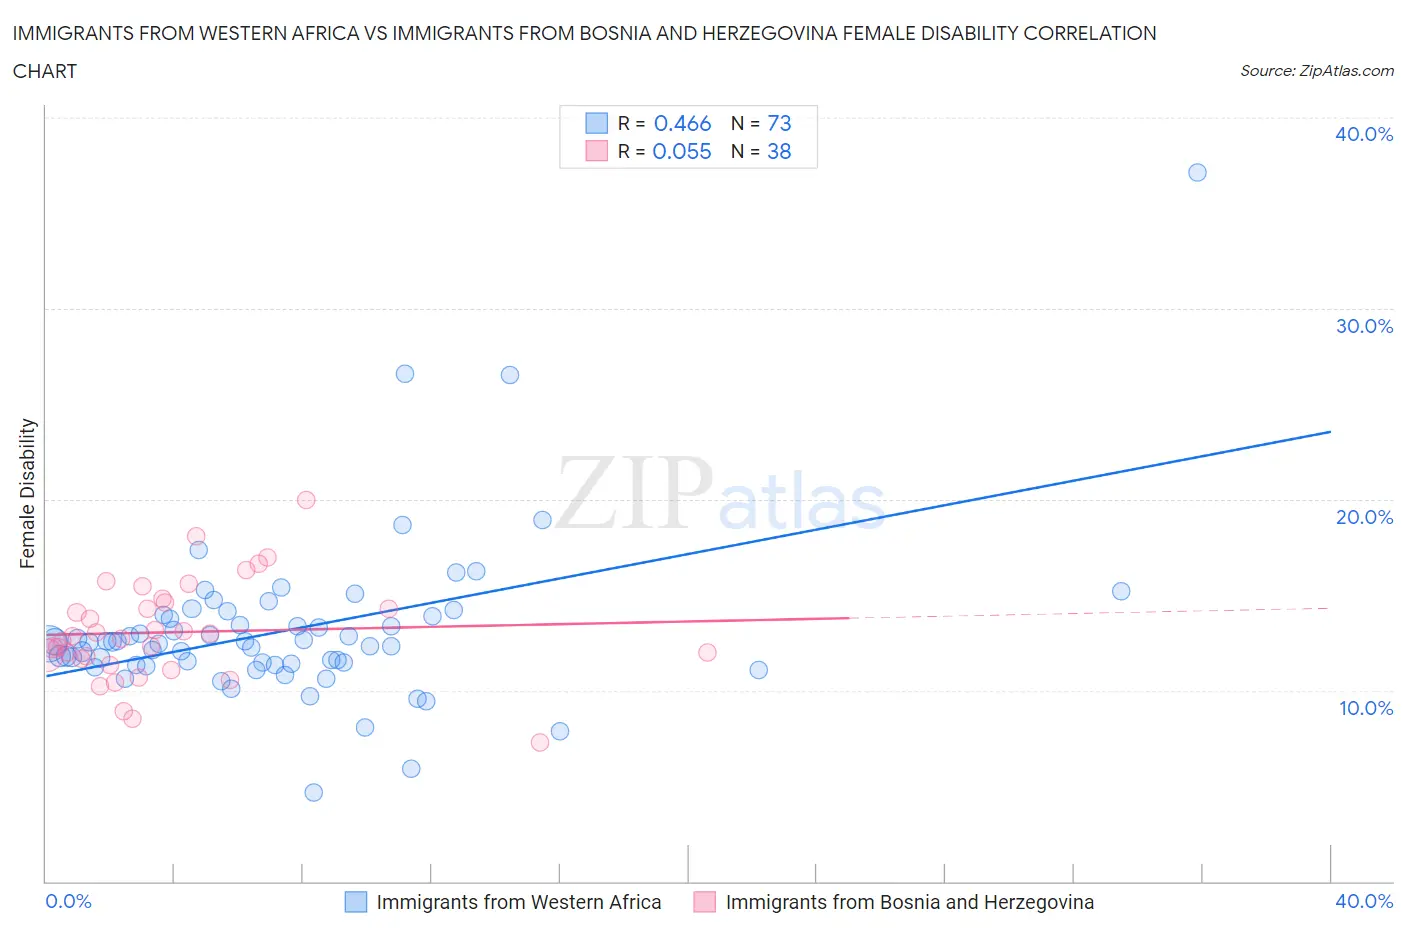
Immigrants from Western Africa vs Immigrants from Bosnia and Herzegovina Female Disability Correlation Chart
The statistical analysis conducted on geographies consisting of 357,800,651 people shows a moderate positive correlation between the proportion of Immigrants from Western Africa and percentage of females with a disability in the United States with a correlation coefficient (R) of 0.466 and weighted average of 12.3%. Similarly, the statistical analysis conducted on geographies consisting of 156,817,163 people shows a slight positive correlation between the proportion of Immigrants from Bosnia and Herzegovina and percentage of females with a disability in the United States with a correlation coefficient (R) of 0.055 and weighted average of 12.4%, a difference of 0.81%.
Female Disability Correlation Summary
| Measurement | Immigrants from Western Africa | Immigrants from Bosnia and Herzegovina |
| Minimum | 4.6% | 7.3% |
| Maximum | 37.1% | 20.0% |
| Range | 32.5% | 12.7% |
| Mean | 13.1% | 13.0% |
| Median | 12.5% | 12.8% |
| Interquartile 25% (IQ1) | 11.3% | 11.7% |
| Interquartile 75% (IQ3) | 13.9% | 14.6% |
| Interquartile Range (IQR) | 2.6% | 2.9% |
| Standard Deviation (Sample) | 4.4% | 2.6% |
| Standard Deviation (Population) | 4.3% | 2.6% |
Demographics Similar to Immigrants from Western Africa and Immigrants from Bosnia and Herzegovina by Female Disability
In terms of female disability, the demographic groups most similar to Immigrants from Western Africa are Armenian (12.3%, a difference of 0.020%), Northern European (12.3%, a difference of 0.080%), Ukrainian (12.3%, a difference of 0.090%), Swedish (12.3%, a difference of 0.12%), and Immigrants from Panama (12.3%, a difference of 0.18%). Similarly, the demographic groups most similar to Immigrants from Bosnia and Herzegovina are Swiss (12.4%, a difference of 0.010%), Mexican (12.4%, a difference of 0.060%), Basque (12.4%, a difference of 0.18%), Immigrants from Cuba (12.4%, a difference of 0.35%), and Croatian (12.4%, a difference of 0.35%).
| Demographics | Rating | Rank | Female Disability |
| Armenians | 29.7 /100 | #191 | Fair 12.3% |
| Immigrants | Western Africa | 29.2 /100 | #192 | Fair 12.3% |
| Northern Europeans | 27.5 /100 | #193 | Fair 12.3% |
| Ukrainians | 27.2 /100 | #194 | Fair 12.3% |
| Swedes | 26.6 /100 | #195 | Fair 12.3% |
| Immigrants | Panama | 25.5 /100 | #196 | Fair 12.3% |
| Hondurans | 25.4 /100 | #197 | Fair 12.3% |
| Mexican American Indians | 24.9 /100 | #198 | Fair 12.3% |
| Immigrants | Trinidad and Tobago | 24.7 /100 | #199 | Fair 12.3% |
| Trinidadians and Tobagonians | 22.4 /100 | #200 | Fair 12.3% |
| Chinese | 22.1 /100 | #201 | Fair 12.3% |
| Somalis | 21.5 /100 | #202 | Fair 12.3% |
| Immigrants | Barbados | 21.1 /100 | #203 | Fair 12.3% |
| Immigrants | Zaire | 20.9 /100 | #204 | Fair 12.3% |
| Immigrants | Grenada | 20.5 /100 | #205 | Fair 12.4% |
| Immigrants | Cuba | 20.2 /100 | #206 | Fair 12.4% |
| Croatians | 20.2 /100 | #207 | Fair 12.4% |
| Basques | 17.5 /100 | #208 | Poor 12.4% |
| Mexicans | 15.7 /100 | #209 | Poor 12.4% |
| Swiss | 14.9 /100 | #210 | Poor 12.4% |
| Immigrants | Bosnia and Herzegovina | 14.8 /100 | #211 | Poor 12.4% |