Immigrants from West Indies vs South American Indian Disability
COMPARE
Immigrants from West Indies
South American Indian
Disability
Disability Comparison
Immigrants from West Indies
South American Indians
11.9%
DISABILITY
21.1/ 100
METRIC RATING
190th/ 347
METRIC RANK
11.4%
DISABILITY
92.2/ 100
METRIC RATING
124th/ 347
METRIC RANK
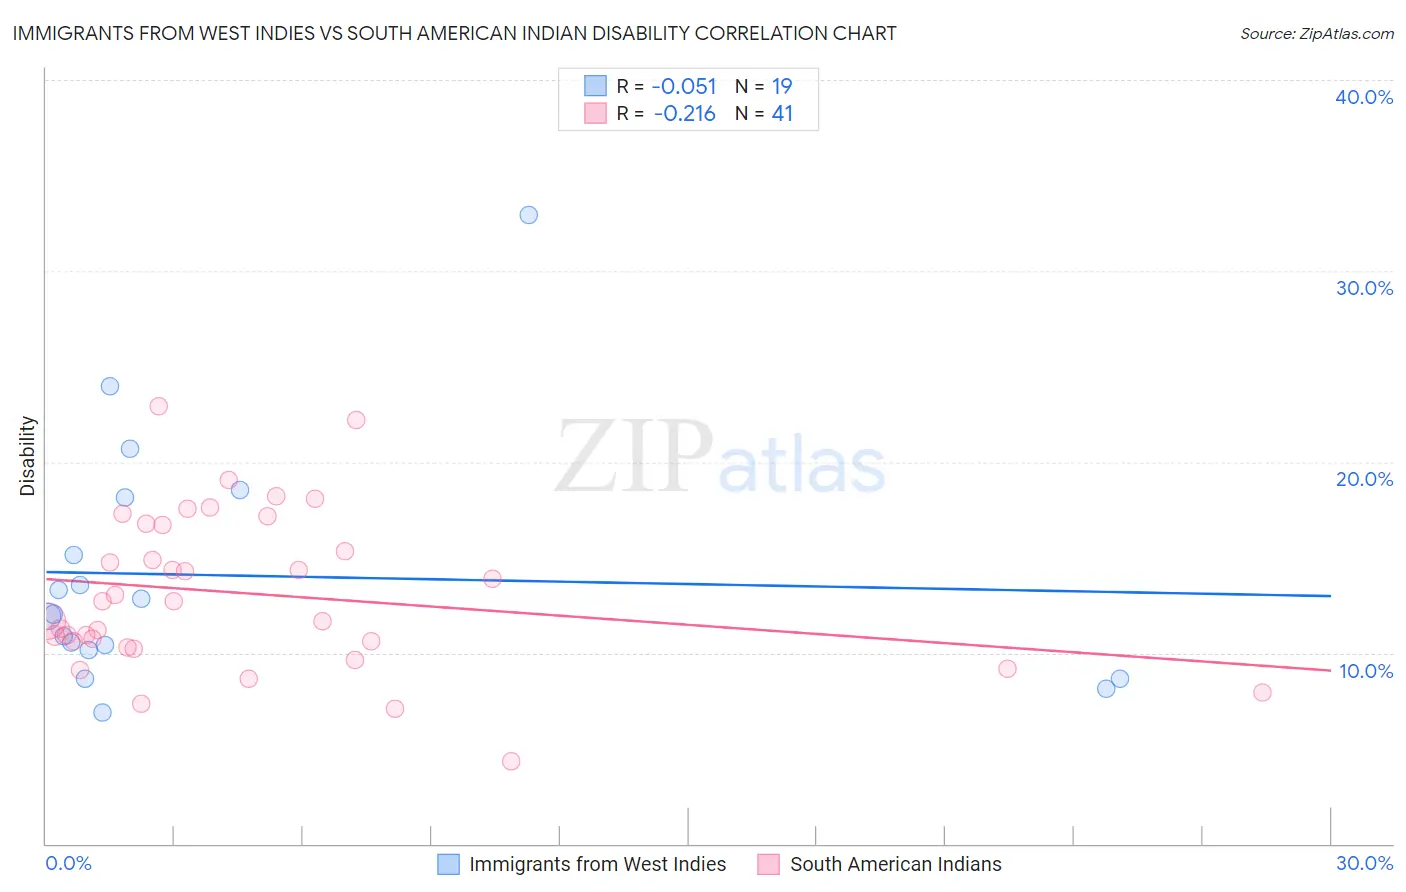
Immigrants from West Indies vs South American Indian Disability Correlation Chart
The statistical analysis conducted on geographies consisting of 72,456,461 people shows a slight negative correlation between the proportion of Immigrants from West Indies and percentage of population with a disability in the United States with a correlation coefficient (R) of -0.051 and weighted average of 11.9%. Similarly, the statistical analysis conducted on geographies consisting of 164,561,915 people shows a weak negative correlation between the proportion of South American Indians and percentage of population with a disability in the United States with a correlation coefficient (R) of -0.216 and weighted average of 11.4%, a difference of 4.3%.
Disability Correlation Summary
| Measurement | Immigrants from West Indies | South American Indian |
| Minimum | 6.9% | 4.3% |
| Maximum | 32.9% | 22.9% |
| Range | 26.0% | 18.6% |
| Mean | 14.1% | 13.1% |
| Median | 12.0% | 12.7% |
| Interquartile 25% (IQ1) | 10.1% | 10.4% |
| Interquartile 75% (IQ3) | 18.1% | 16.7% |
| Interquartile Range (IQR) | 8.0% | 6.3% |
| Standard Deviation (Sample) | 6.4% | 4.1% |
| Standard Deviation (Population) | 6.3% | 4.1% |
Similar Demographics by Disability
Demographics Similar to Immigrants from West Indies by Disability
In terms of disability, the demographic groups most similar to Immigrants from West Indies are Immigrants from Zaire (11.9%, a difference of 0.050%), Ute (11.9%, a difference of 0.11%), Lithuanian (11.9%, a difference of 0.16%), Immigrants from Mexico (11.9%, a difference of 0.17%), and Immigrants from Bosnia and Herzegovina (11.9%, a difference of 0.21%).
| Demographics | Rating | Rank | Disability |
| Hondurans | 31.2 /100 | #183 | Fair 11.8% |
| Iraqis | 30.0 /100 | #184 | Fair 11.8% |
| Immigrants | Burma/Myanmar | 28.5 /100 | #185 | Fair 11.8% |
| Immigrants | Scotland | 28.2 /100 | #186 | Fair 11.8% |
| Lebanese | 27.9 /100 | #187 | Fair 11.8% |
| Immigrants | Mexico | 23.8 /100 | #188 | Fair 11.9% |
| Immigrants | Zaire | 21.8 /100 | #189 | Fair 11.9% |
| Immigrants | West Indies | 21.1 /100 | #190 | Fair 11.9% |
| Ute | 19.5 /100 | #191 | Poor 11.9% |
| Lithuanians | 18.8 /100 | #192 | Poor 11.9% |
| Immigrants | Bosnia and Herzegovina | 18.0 /100 | #193 | Poor 11.9% |
| Somalis | 17.3 /100 | #194 | Poor 11.9% |
| Barbadians | 15.8 /100 | #195 | Poor 11.9% |
| Serbians | 15.4 /100 | #196 | Poor 11.9% |
| Immigrants | Belize | 15.2 /100 | #197 | Poor 11.9% |
Demographics Similar to South American Indians by Disability
In terms of disability, the demographic groups most similar to South American Indians are South African (11.4%, a difference of 0.020%), Costa Rican (11.4%, a difference of 0.040%), Brazilian (11.4%, a difference of 0.19%), Immigrants from Latvia (11.4%, a difference of 0.19%), and Immigrants from North Macedonia (11.4%, a difference of 0.22%).
| Demographics | Rating | Rank | Disability |
| Luxembourgers | 93.9 /100 | #117 | Exceptional 11.3% |
| Koreans | 93.8 /100 | #118 | Exceptional 11.3% |
| Central Americans | 93.5 /100 | #119 | Exceptional 11.4% |
| Immigrants | North Macedonia | 93.5 /100 | #120 | Exceptional 11.4% |
| Immigrants | Costa Rica | 93.4 /100 | #121 | Exceptional 11.4% |
| Brazilians | 93.3 /100 | #122 | Exceptional 11.4% |
| South Africans | 92.3 /100 | #123 | Exceptional 11.4% |
| South American Indians | 92.2 /100 | #124 | Exceptional 11.4% |
| Costa Ricans | 91.9 /100 | #125 | Exceptional 11.4% |
| Immigrants | Latvia | 90.9 /100 | #126 | Exceptional 11.4% |
| Immigrants | Italy | 90.4 /100 | #127 | Exceptional 11.4% |
| Immigrants | Europe | 90.4 /100 | #128 | Exceptional 11.4% |
| Macedonians | 90.3 /100 | #129 | Exceptional 11.4% |
| Latvians | 89.8 /100 | #130 | Excellent 11.4% |
| Immigrants | Croatia | 89.8 /100 | #131 | Excellent 11.4% |