Immigrants from Venezuela vs Ottawa Cognitive Disability
COMPARE
Immigrants from Venezuela
Ottawa
Cognitive Disability
Cognitive Disability Comparison
Immigrants from Venezuela
Ottawa
16.5%
COGNITIVE DISABILITY
99.7/ 100
METRIC RATING
55th/ 347
METRIC RANK
18.2%
COGNITIVE DISABILITY
0.1/ 100
METRIC RATING
291st/ 347
METRIC RANK
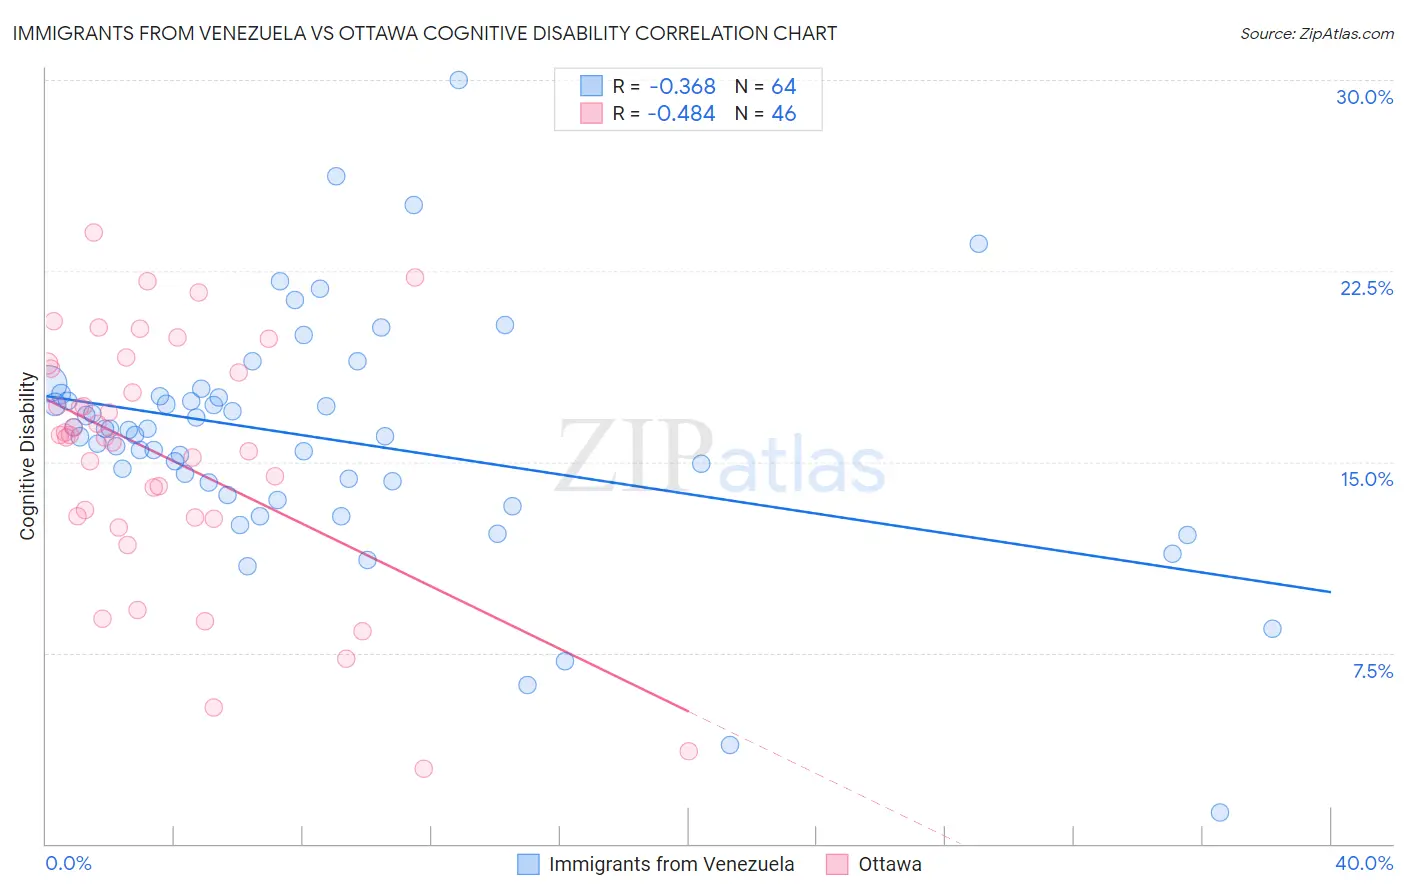
Immigrants from Venezuela vs Ottawa Cognitive Disability Correlation Chart
The statistical analysis conducted on geographies consisting of 287,845,766 people shows a mild negative correlation between the proportion of Immigrants from Venezuela and percentage of population with cognitive disability in the United States with a correlation coefficient (R) of -0.368 and weighted average of 16.5%. Similarly, the statistical analysis conducted on geographies consisting of 49,955,191 people shows a moderate negative correlation between the proportion of Ottawa and percentage of population with cognitive disability in the United States with a correlation coefficient (R) of -0.484 and weighted average of 18.2%, a difference of 9.8%.
Cognitive Disability Correlation Summary
| Measurement | Immigrants from Venezuela | Ottawa |
| Minimum | 1.2% | 2.9% |
| Maximum | 30.0% | 24.0% |
| Range | 28.8% | 21.0% |
| Mean | 15.9% | 15.2% |
| Median | 16.1% | 16.0% |
| Interquartile 25% (IQ1) | 14.0% | 12.8% |
| Interquartile 75% (IQ3) | 17.6% | 18.7% |
| Interquartile Range (IQR) | 3.6% | 5.9% |
| Standard Deviation (Sample) | 4.7% | 4.9% |
| Standard Deviation (Population) | 4.7% | 4.8% |
Similar Demographics by Cognitive Disability
Demographics Similar to Immigrants from Venezuela by Cognitive Disability
In terms of cognitive disability, the demographic groups most similar to Immigrants from Venezuela are Immigrants from Iran (16.5%, a difference of 0.090%), Austrian (16.6%, a difference of 0.090%), Bhutanese (16.6%, a difference of 0.10%), Swedish (16.5%, a difference of 0.13%), and Pennsylvania German (16.6%, a difference of 0.17%).
| Demographics | Rating | Rank | Cognitive Disability |
| Immigrants | North America | 99.8 /100 | #48 | Exceptional 16.5% |
| Iranians | 99.8 /100 | #49 | Exceptional 16.5% |
| Norwegians | 99.8 /100 | #50 | Exceptional 16.5% |
| Immigrants | Korea | 99.8 /100 | #51 | Exceptional 16.5% |
| Soviet Union | 99.8 /100 | #52 | Exceptional 16.5% |
| Swedes | 99.8 /100 | #53 | Exceptional 16.5% |
| Immigrants | Iran | 99.8 /100 | #54 | Exceptional 16.5% |
| Immigrants | Venezuela | 99.7 /100 | #55 | Exceptional 16.5% |
| Austrians | 99.7 /100 | #56 | Exceptional 16.6% |
| Bhutanese | 99.7 /100 | #57 | Exceptional 16.6% |
| Pennsylvania Germans | 99.7 /100 | #58 | Exceptional 16.6% |
| Immigrants | Peru | 99.7 /100 | #59 | Exceptional 16.6% |
| Romanians | 99.7 /100 | #60 | Exceptional 16.6% |
| Immigrants | England | 99.6 /100 | #61 | Exceptional 16.6% |
| Czechoslovakians | 99.6 /100 | #62 | Exceptional 16.6% |
Demographics Similar to Ottawa by Cognitive Disability
In terms of cognitive disability, the demographic groups most similar to Ottawa are Iroquois (18.2%, a difference of 0.070%), Central American Indian (18.2%, a difference of 0.080%), Immigrants from Africa (18.1%, a difference of 0.13%), British West Indian (18.2%, a difference of 0.15%), and Native/Alaskan (18.1%, a difference of 0.16%).
| Demographics | Rating | Rank | Cognitive Disability |
| Immigrants | Uganda | 0.1 /100 | #284 | Tragic 18.1% |
| Bermudans | 0.1 /100 | #285 | Tragic 18.1% |
| Kenyans | 0.1 /100 | #286 | Tragic 18.1% |
| Dutch West Indians | 0.1 /100 | #287 | Tragic 18.1% |
| Immigrants | West Indies | 0.1 /100 | #288 | Tragic 18.1% |
| Natives/Alaskans | 0.1 /100 | #289 | Tragic 18.1% |
| Immigrants | Africa | 0.1 /100 | #290 | Tragic 18.1% |
| Ottawa | 0.1 /100 | #291 | Tragic 18.2% |
| Iroquois | 0.1 /100 | #292 | Tragic 18.2% |
| Central American Indians | 0.1 /100 | #293 | Tragic 18.2% |
| British West Indians | 0.1 /100 | #294 | Tragic 18.2% |
| German Russians | 0.0 /100 | #295 | Tragic 18.2% |
| Immigrants | Burma/Myanmar | 0.0 /100 | #296 | Tragic 18.2% |
| Blackfeet | 0.0 /100 | #297 | Tragic 18.3% |
| Japanese | 0.0 /100 | #298 | Tragic 18.3% |