Immigrants from Venezuela vs Guyanese Cognitive Disability
COMPARE
Immigrants from Venezuela
Guyanese
Cognitive Disability
Cognitive Disability Comparison
Immigrants from Venezuela
Guyanese
16.5%
COGNITIVE DISABILITY
99.7/ 100
METRIC RATING
55th/ 347
METRIC RANK
17.5%
COGNITIVE DISABILITY
17.5/ 100
METRIC RATING
196th/ 347
METRIC RANK
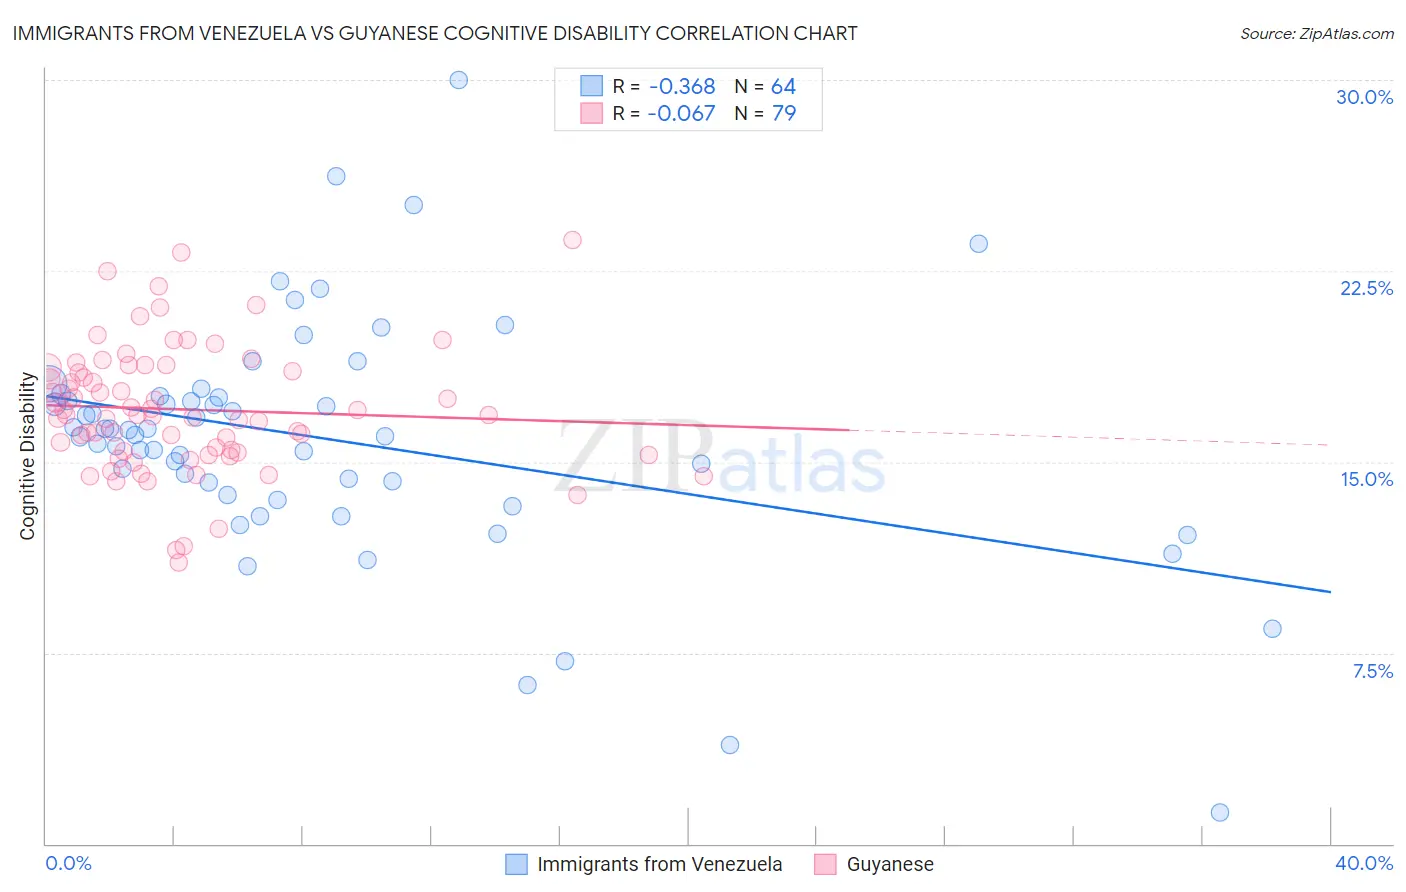
Immigrants from Venezuela vs Guyanese Cognitive Disability Correlation Chart
The statistical analysis conducted on geographies consisting of 287,845,766 people shows a mild negative correlation between the proportion of Immigrants from Venezuela and percentage of population with cognitive disability in the United States with a correlation coefficient (R) of -0.368 and weighted average of 16.5%. Similarly, the statistical analysis conducted on geographies consisting of 176,911,686 people shows a slight negative correlation between the proportion of Guyanese and percentage of population with cognitive disability in the United States with a correlation coefficient (R) of -0.067 and weighted average of 17.5%, a difference of 5.6%.
Cognitive Disability Correlation Summary
| Measurement | Immigrants from Venezuela | Guyanese |
| Minimum | 1.2% | 11.0% |
| Maximum | 30.0% | 23.7% |
| Range | 28.8% | 12.7% |
| Mean | 15.9% | 17.1% |
| Median | 16.1% | 16.9% |
| Interquartile 25% (IQ1) | 14.0% | 15.4% |
| Interquartile 75% (IQ3) | 17.6% | 18.7% |
| Interquartile Range (IQR) | 3.6% | 3.3% |
| Standard Deviation (Sample) | 4.7% | 2.5% |
| Standard Deviation (Population) | 4.7% | 2.5% |
Similar Demographics by Cognitive Disability
Demographics Similar to Immigrants from Venezuela by Cognitive Disability
In terms of cognitive disability, the demographic groups most similar to Immigrants from Venezuela are Immigrants from Iran (16.5%, a difference of 0.090%), Austrian (16.6%, a difference of 0.090%), Bhutanese (16.6%, a difference of 0.10%), Swedish (16.5%, a difference of 0.13%), and Pennsylvania German (16.6%, a difference of 0.17%).
| Demographics | Rating | Rank | Cognitive Disability |
| Immigrants | North America | 99.8 /100 | #48 | Exceptional 16.5% |
| Iranians | 99.8 /100 | #49 | Exceptional 16.5% |
| Norwegians | 99.8 /100 | #50 | Exceptional 16.5% |
| Immigrants | Korea | 99.8 /100 | #51 | Exceptional 16.5% |
| Soviet Union | 99.8 /100 | #52 | Exceptional 16.5% |
| Swedes | 99.8 /100 | #53 | Exceptional 16.5% |
| Immigrants | Iran | 99.8 /100 | #54 | Exceptional 16.5% |
| Immigrants | Venezuela | 99.7 /100 | #55 | Exceptional 16.5% |
| Austrians | 99.7 /100 | #56 | Exceptional 16.6% |
| Bhutanese | 99.7 /100 | #57 | Exceptional 16.6% |
| Pennsylvania Germans | 99.7 /100 | #58 | Exceptional 16.6% |
| Immigrants | Peru | 99.7 /100 | #59 | Exceptional 16.6% |
| Romanians | 99.7 /100 | #60 | Exceptional 16.6% |
| Immigrants | England | 99.6 /100 | #61 | Exceptional 16.6% |
| Czechoslovakians | 99.6 /100 | #62 | Exceptional 16.6% |
Demographics Similar to Guyanese by Cognitive Disability
In terms of cognitive disability, the demographic groups most similar to Guyanese are Immigrants from Afghanistan (17.5%, a difference of 0.040%), Immigrants from Panama (17.5%, a difference of 0.14%), New Zealander (17.4%, a difference of 0.16%), Immigrants from Singapore (17.5%, a difference of 0.17%), and Haitian (17.5%, a difference of 0.18%).
| Demographics | Rating | Rank | Cognitive Disability |
| Immigrants | Western Asia | 29.5 /100 | #189 | Fair 17.4% |
| Immigrants | Spain | 27.7 /100 | #190 | Fair 17.4% |
| Immigrants | Nonimmigrants | 27.4 /100 | #191 | Fair 17.4% |
| Immigrants | Haiti | 27.1 /100 | #192 | Fair 17.4% |
| Delaware | 25.6 /100 | #193 | Fair 17.4% |
| Immigrants | Bosnia and Herzegovina | 22.0 /100 | #194 | Fair 17.4% |
| New Zealanders | 21.1 /100 | #195 | Fair 17.4% |
| Guyanese | 17.5 /100 | #196 | Poor 17.5% |
| Immigrants | Afghanistan | 16.7 /100 | #197 | Poor 17.5% |
| Immigrants | Panama | 14.8 /100 | #198 | Poor 17.5% |
| Immigrants | Singapore | 14.3 /100 | #199 | Poor 17.5% |
| Haitians | 14.1 /100 | #200 | Poor 17.5% |
| South American Indians | 13.0 /100 | #201 | Poor 17.5% |
| Immigrants | Morocco | 12.0 /100 | #202 | Poor 17.5% |
| Immigrants | Caribbean | 11.0 /100 | #203 | Poor 17.5% |