Alaskan Athabascan vs French Cognitive Disability
COMPARE
Alaskan Athabascan
French
Cognitive Disability
Cognitive Disability Comparison
Alaskan Athabascans
French
17.6%
COGNITIVE DISABILITY
6.9/ 100
METRIC RATING
215th/ 347
METRIC RANK
17.0%
COGNITIVE DISABILITY
90.0/ 100
METRIC RATING
139th/ 347
METRIC RANK
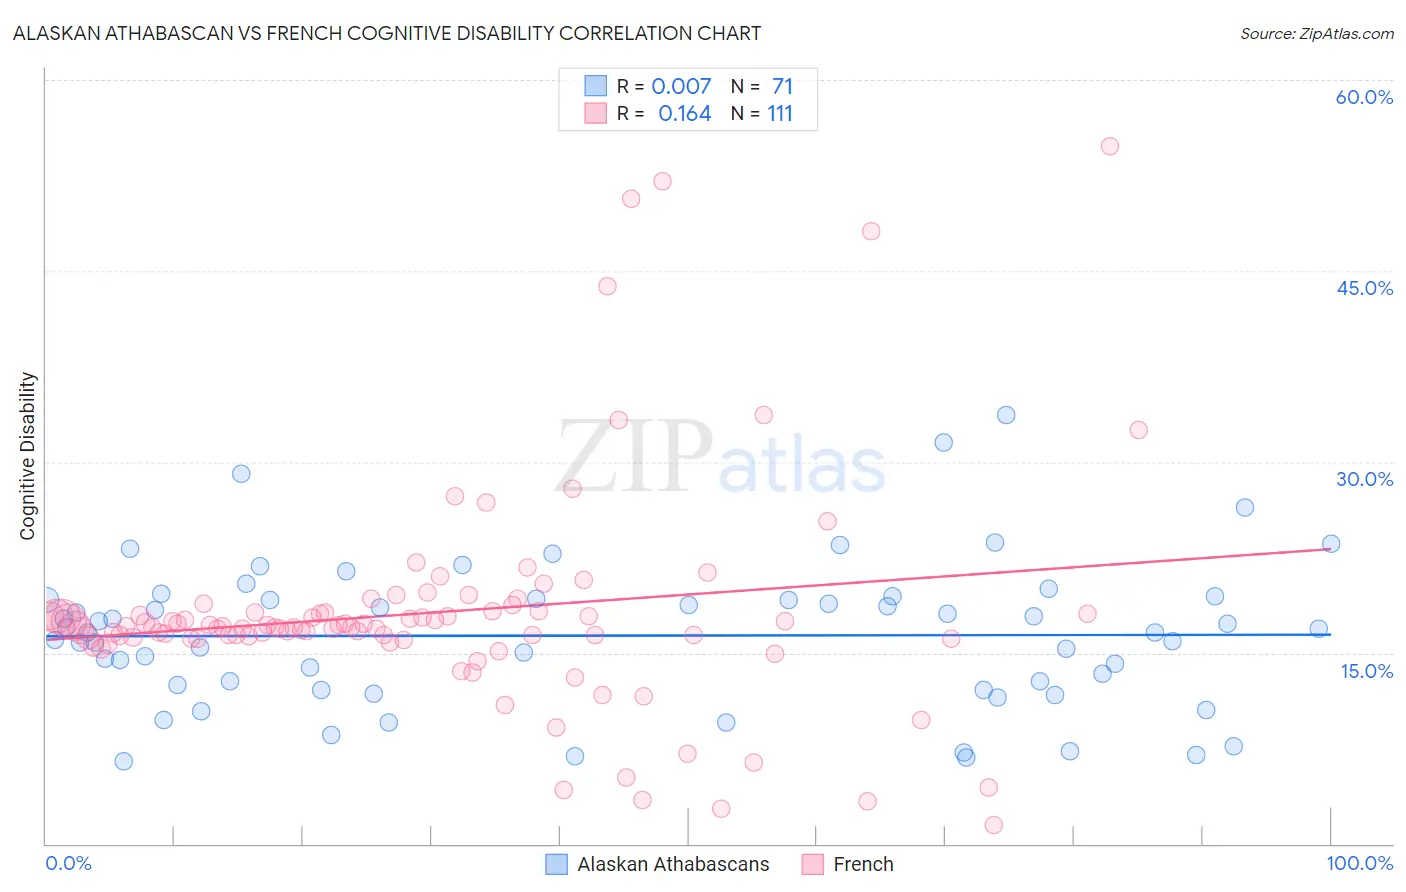
Alaskan Athabascan vs French Cognitive Disability Correlation Chart
The statistical analysis conducted on geographies consisting of 45,820,962 people shows no correlation between the proportion of Alaskan Athabascans and percentage of population with cognitive disability in the United States with a correlation coefficient (R) of 0.007 and weighted average of 17.6%. Similarly, the statistical analysis conducted on geographies consisting of 572,255,575 people shows a poor positive correlation between the proportion of French and percentage of population with cognitive disability in the United States with a correlation coefficient (R) of 0.164 and weighted average of 17.0%, a difference of 3.5%.
Cognitive Disability Correlation Summary
| Measurement | Alaskan Athabascan | French |
| Minimum | 6.5% | 1.5% |
| Maximum | 33.7% | 54.8% |
| Range | 27.2% | 53.3% |
| Mean | 16.4% | 18.2% |
| Median | 16.6% | 17.0% |
| Interquartile 25% (IQ1) | 12.1% | 16.1% |
| Interquartile 75% (IQ3) | 19.2% | 18.2% |
| Interquartile Range (IQR) | 7.2% | 2.1% |
| Standard Deviation (Sample) | 5.7% | 8.8% |
| Standard Deviation (Population) | 5.7% | 8.7% |
Similar Demographics by Cognitive Disability
Demographics Similar to Alaskan Athabascans by Cognitive Disability
In terms of cognitive disability, the demographic groups most similar to Alaskan Athabascans are Immigrants from El Salvador (17.6%, a difference of 0.010%), Okinawan (17.6%, a difference of 0.010%), Salvadoran (17.6%, a difference of 0.020%), Hawaiian (17.6%, a difference of 0.030%), and Immigrants from Oceania (17.6%, a difference of 0.050%).
| Demographics | Rating | Rank | Cognitive Disability |
| Immigrants | Cameroon | 9.3 /100 | #208 | Tragic 17.6% |
| Immigrants | Trinidad and Tobago | 8.7 /100 | #209 | Tragic 17.6% |
| Immigrants | Jamaica | 8.5 /100 | #210 | Tragic 17.6% |
| Taiwanese | 7.7 /100 | #211 | Tragic 17.6% |
| Immigrants | Oceania | 7.3 /100 | #212 | Tragic 17.6% |
| Hawaiians | 7.2 /100 | #213 | Tragic 17.6% |
| Immigrants | El Salvador | 7.0 /100 | #214 | Tragic 17.6% |
| Alaskan Athabascans | 6.9 /100 | #215 | Tragic 17.6% |
| Okinawans | 6.8 /100 | #216 | Tragic 17.6% |
| Salvadorans | 6.7 /100 | #217 | Tragic 17.6% |
| Icelanders | 6.4 /100 | #218 | Tragic 17.6% |
| Immigrants | Sierra Leone | 6.3 /100 | #219 | Tragic 17.6% |
| Zimbabweans | 6.1 /100 | #220 | Tragic 17.6% |
| Moroccans | 5.9 /100 | #221 | Tragic 17.6% |
| Central Americans | 4.5 /100 | #222 | Tragic 17.7% |
Demographics Similar to French by Cognitive Disability
In terms of cognitive disability, the demographic groups most similar to French are Chilean (17.0%, a difference of 0.0%), Aleut (17.0%, a difference of 0.0%), Carpatho Rusyn (17.0%, a difference of 0.030%), British (17.0%, a difference of 0.050%), and Immigrants from Brazil (17.0%, a difference of 0.050%).
| Demographics | Rating | Rank | Cognitive Disability |
| Whites/Caucasians | 92.1 /100 | #132 | Exceptional 17.0% |
| Immigrants | Jordan | 91.9 /100 | #133 | Exceptional 17.0% |
| Immigrants | Chile | 91.7 /100 | #134 | Exceptional 17.0% |
| Lebanese | 91.3 /100 | #135 | Exceptional 17.0% |
| Israelis | 91.0 /100 | #136 | Exceptional 17.0% |
| Immigrants | Norway | 90.9 /100 | #137 | Exceptional 17.0% |
| Welsh | 90.8 /100 | #138 | Exceptional 17.0% |
| French | 90.0 /100 | #139 | Excellent 17.0% |
| Chileans | 89.9 /100 | #140 | Excellent 17.0% |
| Aleuts | 89.9 /100 | #141 | Excellent 17.0% |
| Carpatho Rusyns | 89.6 /100 | #142 | Excellent 17.0% |
| British | 89.3 /100 | #143 | Excellent 17.0% |
| Immigrants | Brazil | 89.3 /100 | #144 | Excellent 17.0% |
| Immigrants | South Eastern Asia | 88.7 /100 | #145 | Excellent 17.0% |
| Costa Ricans | 88.0 /100 | #146 | Excellent 17.0% |