Immigrants from Venezuela vs Serbian Cognitive Disability
COMPARE
Immigrants from Venezuela
Serbian
Cognitive Disability
Cognitive Disability Comparison
Immigrants from Venezuela
Serbians
16.5%
COGNITIVE DISABILITY
99.7/ 100
METRIC RATING
55th/ 347
METRIC RANK
16.7%
COGNITIVE DISABILITY
99.1/ 100
METRIC RATING
83rd/ 347
METRIC RANK
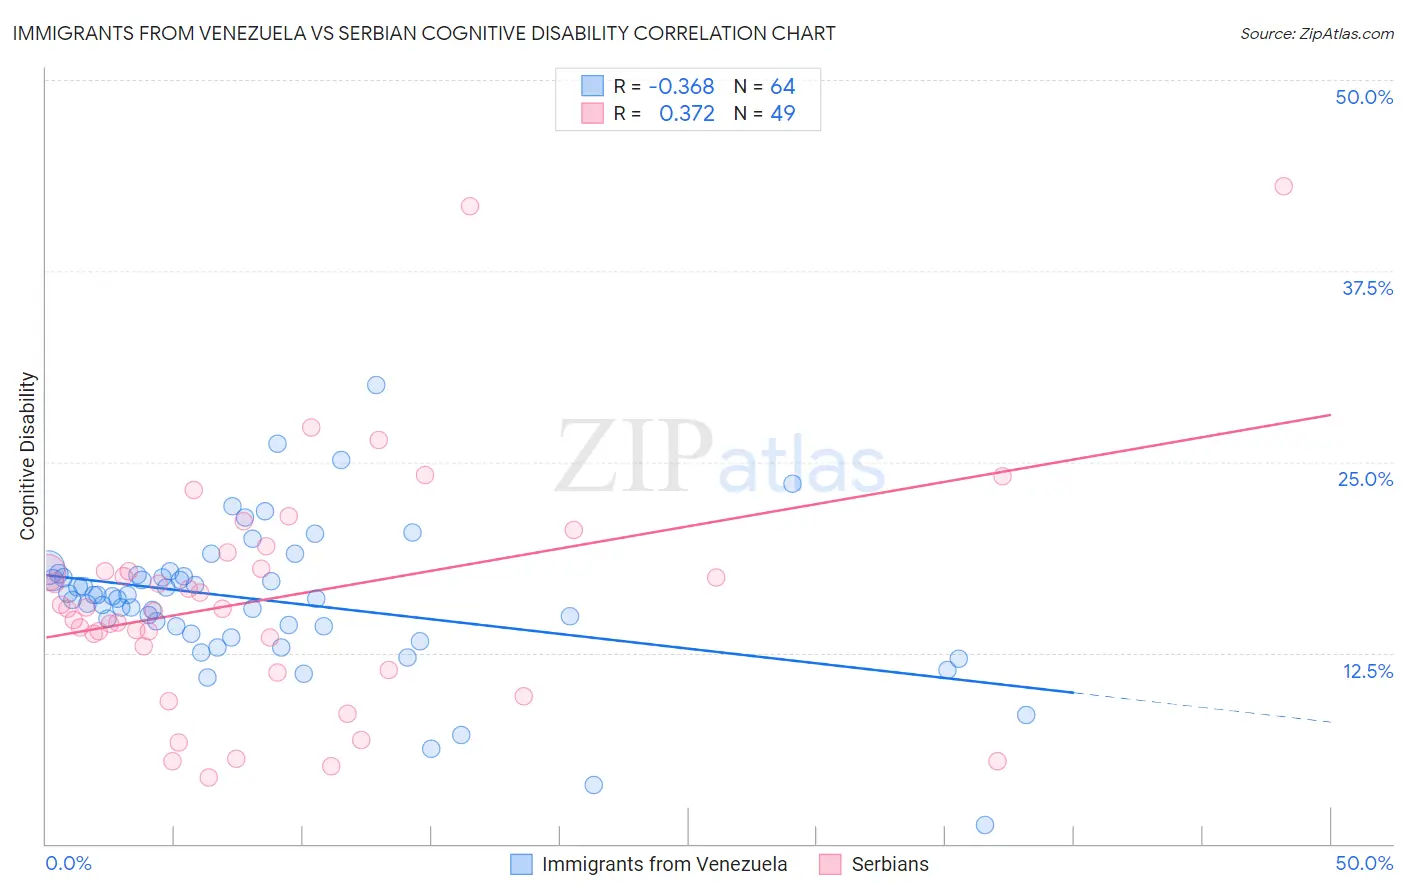
Immigrants from Venezuela vs Serbian Cognitive Disability Correlation Chart
The statistical analysis conducted on geographies consisting of 287,845,766 people shows a mild negative correlation between the proportion of Immigrants from Venezuela and percentage of population with cognitive disability in the United States with a correlation coefficient (R) of -0.368 and weighted average of 16.5%. Similarly, the statistical analysis conducted on geographies consisting of 267,644,527 people shows a mild positive correlation between the proportion of Serbians and percentage of population with cognitive disability in the United States with a correlation coefficient (R) of 0.372 and weighted average of 16.7%, a difference of 0.89%.
Cognitive Disability Correlation Summary
| Measurement | Immigrants from Venezuela | Serbian |
| Minimum | 1.2% | 4.3% |
| Maximum | 30.0% | 43.1% |
| Range | 28.8% | 38.7% |
| Mean | 15.9% | 16.1% |
| Median | 16.1% | 15.4% |
| Interquartile 25% (IQ1) | 14.0% | 12.1% |
| Interquartile 75% (IQ3) | 17.6% | 18.6% |
| Interquartile Range (IQR) | 3.6% | 6.4% |
| Standard Deviation (Sample) | 4.7% | 7.8% |
| Standard Deviation (Population) | 4.7% | 7.7% |
Similar Demographics by Cognitive Disability
Demographics Similar to Immigrants from Venezuela by Cognitive Disability
In terms of cognitive disability, the demographic groups most similar to Immigrants from Venezuela are Immigrants from Iran (16.5%, a difference of 0.090%), Austrian (16.6%, a difference of 0.090%), Bhutanese (16.6%, a difference of 0.10%), Swedish (16.5%, a difference of 0.13%), and Pennsylvania German (16.6%, a difference of 0.17%).
| Demographics | Rating | Rank | Cognitive Disability |
| Immigrants | North America | 99.8 /100 | #48 | Exceptional 16.5% |
| Iranians | 99.8 /100 | #49 | Exceptional 16.5% |
| Norwegians | 99.8 /100 | #50 | Exceptional 16.5% |
| Immigrants | Korea | 99.8 /100 | #51 | Exceptional 16.5% |
| Soviet Union | 99.8 /100 | #52 | Exceptional 16.5% |
| Swedes | 99.8 /100 | #53 | Exceptional 16.5% |
| Immigrants | Iran | 99.8 /100 | #54 | Exceptional 16.5% |
| Immigrants | Venezuela | 99.7 /100 | #55 | Exceptional 16.5% |
| Austrians | 99.7 /100 | #56 | Exceptional 16.6% |
| Bhutanese | 99.7 /100 | #57 | Exceptional 16.6% |
| Pennsylvania Germans | 99.7 /100 | #58 | Exceptional 16.6% |
| Immigrants | Peru | 99.7 /100 | #59 | Exceptional 16.6% |
| Romanians | 99.7 /100 | #60 | Exceptional 16.6% |
| Immigrants | England | 99.6 /100 | #61 | Exceptional 16.6% |
| Czechoslovakians | 99.6 /100 | #62 | Exceptional 16.6% |
Demographics Similar to Serbians by Cognitive Disability
In terms of cognitive disability, the demographic groups most similar to Serbians are Belgian (16.7%, a difference of 0.020%), Immigrants from Moldova (16.7%, a difference of 0.030%), Swiss (16.7%, a difference of 0.070%), Immigrants from South Africa (16.7%, a difference of 0.070%), and Native Hawaiian (16.7%, a difference of 0.080%).
| Demographics | Rating | Rank | Cognitive Disability |
| Immigrants | Serbia | 99.3 /100 | #76 | Exceptional 16.7% |
| Immigrants | Hungary | 99.3 /100 | #77 | Exceptional 16.7% |
| Peruvians | 99.3 /100 | #78 | Exceptional 16.7% |
| Immigrants | Bulgaria | 99.3 /100 | #79 | Exceptional 16.7% |
| Egyptians | 99.2 /100 | #80 | Exceptional 16.7% |
| Immigrants | Netherlands | 99.2 /100 | #81 | Exceptional 16.7% |
| Swiss | 99.2 /100 | #82 | Exceptional 16.7% |
| Serbians | 99.1 /100 | #83 | Exceptional 16.7% |
| Belgians | 99.1 /100 | #84 | Exceptional 16.7% |
| Immigrants | Moldova | 99.1 /100 | #85 | Exceptional 16.7% |
| Immigrants | South Africa | 99.0 /100 | #86 | Exceptional 16.7% |
| Native Hawaiians | 99.0 /100 | #87 | Exceptional 16.7% |
| Immigrants | Philippines | 99.0 /100 | #88 | Exceptional 16.7% |
| Immigrants | Egypt | 98.8 /100 | #89 | Exceptional 16.7% |
| South Americans | 98.8 /100 | #90 | Exceptional 16.7% |